
 Delineation of Saltwater and Freshwater Interphasein Beach Groundwater Study Using 2D ERITechnique in the Northern Sector of the Gulf of Mannar Coast, Tamilnadu
Antony Ravindran A1*, Ramanujam N2 and Sudarsan R3
1Department of Geology, Geophysics Research Lab, Manonmaniam Sundaranar University,V.O.Chidambaram College,Thoothukudi
2Pondicherry University, Disaster Management, Andaman
3Indra Ghandi National Open University, New Delhi
*Correspondence E-mail: antonicogeo@gmail.com
Key Words: Freshwater, Saline Water, Resistivity, 2D ERI, Gulf of Mannar
Received February 26th, 2012; Accepted March 3rd, 2013; Published April 14th, 2013; Available online April 20th,2013
Abstract
The aim of the study is about how beaches in the study area act like a sponge but the groundwater along the beach is very dynamic. The flow direction of the beach groundwater is mainly governed by the physical and geological characteristics of the beaches as well as the waves and tide conditions in the sea. In the northern sector of the study area there are a number of open wells close to the sea being used to draw water for portable purposes by the villagers settled along the beaches. Such field observation suggests that the seawater intrusion is limited in some areas of the study area. Through the 2D Electrical Resistivity Imaging (ERI) technique, an attempt is made to understand the interface zone of the seawater intrusion and the land groundwater along the beach groundwater table. This technique involves the transition of electrical currents into the ground between two electrodes and measuring of voltage between the other two electrodes in transect, the profile with predetermined interval of distances either parallel or perpendicular to the coastal zone is decided. CRM-500 resistivity measuring instrument, multicore cable, stainless steel electrodes are the hardware and “RES2DINV” is the software that were used for conducting the 2D Electrical Resistivity Imaging study.
Article Outline
Introduction
The Electrical Resistivity Imaging with an aid of topographical variation helps in identifying the saltwater intrusion along the beaches perpendicular to the coastline 120m from the high waterline in the areas of Valinockam terrace, Keelamundal, Narippaiyur, Mookkaiyur, Vellapatti and Vembar. The coast between Valinokkam Point and Ramen Point, about 32 miles ENE, is fronted by a chain of islands and shoals extending up to 6 miles offshore. Valinokkam Point is marked by a beacon, 6m high. A submerged rock is marked by a beacon about 1.5 miles NE. These beacons are useful marks for vessels making for the west entrance of Kilakarrai Passage, between Valinokkam Point and Anaipar Tivu (Anapipar Tivu), about 2 miles east. Depths outside this chain of islands and shoals are regular, but in places overfalls occur. The resistivity of the rocks varies with porosity, fracture, fracture filling fluids and fluid saturation (Sudo et al. 2004). The seaward flow of freshwater is gained by the recharge in the hinterland area through rain fall and river and also the product of pressure gradients existing within the coastal medium. The influence of oceanic oscillations (tides and waves) on the exchanges processes occurring at the ocean beach interfaces. The saltwater intrusion in the coastal aquifers has thoroughly been studied using observation wells and water sample analysis. The shortcoming of water wells to map the saltwater intrusion is that lateral resolution is limited by well spacing which in turn is controlled by the access and economic issues. With the change of pressure gradient in the beach zone due to oceanic oscillation (tide and waves) and chemical weathering are the major causes for the degradation of coastal aquifers. The utilization of freshwater resources by sinking of wells into freshwater aquifer and abstraction via pumping altered the subsurface pressure gradient on head. The intrusion not only renders the resource within the aquifer useless but also alters the chemical composition of the groundwater in the coastal aquifer. The compaction of crystalline rocks reveals the low porosity and sedimentary rocks as sandstone has high porosity due to loose packing in. On the contrary the relationship between electrical resistivity and hydraulic conductivity is direct, thereby the porous permeable dry sand show high electrical resistivity values. In the Valinockam terrace three ERI surveys, two as continuous ERI (120 + 120m) and another one ERI to a length of 120m and other locations such as Keelamundal (2 Survey), South Narippaiyur, Mookkaiyur, Vellapatti and Vembar single surveys were carried out to a length of 120m respectively. The use of geophysics in shallow invest-igations, such as in coastal aquifers, dunes, saltwater, freshwater, sea water intrusion studies requires the development for future trends in the study area. The high resolution equipments were used for data acquisition and interpretation techniques to interpret 2D ERI technique in terms of geological formations. The 2D Electrical Resistivity Imaging method using multicore cable with Wenner array were used for the subsurface condition of sea water intrusion and coastal aquifers in the study area (Fig. 1).

Figure 1: Location map of the study area
Materials and Methods
The scanning of the 2D Electrical Resistivity Imaging (ERI) starts from the high water line and moves perpendicular to the shoreline towards the landward side. In this technique forty (40) stainless steel electrodes are pierced 30cm to 40cm into the beach surface with an interval of 3m each. These electrodes are connected through multicore cables to a switching panel which is placed in the middle of the profile. The current and potential terminals from the switch panel are connected to the respective terminals of the CRM 500 Resistivity meter. The switching panel consist series of sockets connected to the electrodes through the multicore cable system. The current terminal pin and the potential terminal pin which are connected with the current source and the resistivity measuring instrument can be inserted in the appropriate sockets for measuring the resistivity between any two electrodes without actually changing the electrodes along the profile. The multiple sounding along the selected profile registered the horizontal and vertical resistivity changes. These resistivity values are used to create a 2D Electrical Resistivity Images of the cross section of the profile. The pseudo section contouring method is used to plot the data collected through the field experiments (Antony Ravindran 2010, Voeikov 1988, Post 2005). The pseudo-section reflects the true resistivity distribution along the profile and therefore can be used as a base for qualitative interpretation. To minimize the differences between the measured and the calculated apparent resistivity values, the inversion method is applied (Antony Ravindran et al. 2012). The inversion method projects a 2D model of a subsurface by using the measured data and by using RES2DINV software program.
Electrical Resistivity Imaging Survey
In the Keelamundal area the apparent resistivity value ranges from 1.29 Ohm.m to 1217 Ohm.m (Figures 2.1 and 2.2).
Similarly the minimum and maximum apparent resistivity values for South Narippaiyur, Mookkaiyur, Vellapatti and Vembar are also recorded as 0.39 Ohm.m to 3019 Ohm.m (Figure 2.2).

Figure 2.1: 2D Electrical resistivity imaging section show the salt and fresh water interphase at Valinockam-1, Valinockam-2 and Valinockam-3.

Figure 2.2: 2D Electrical resistivity imaging section show the salt and fresh water interphase at Keelamundal-1 and Keelamundal-2.
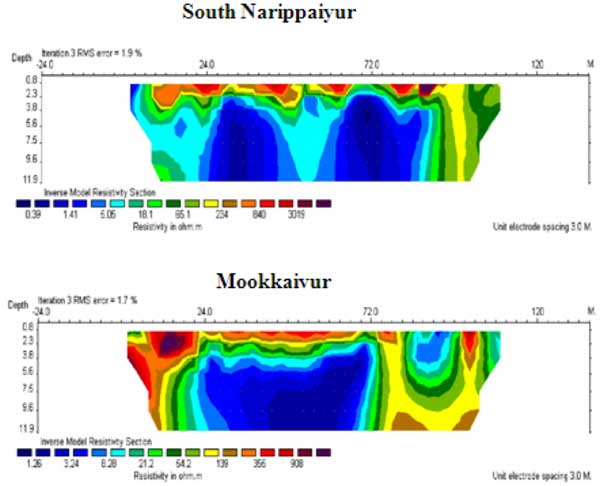
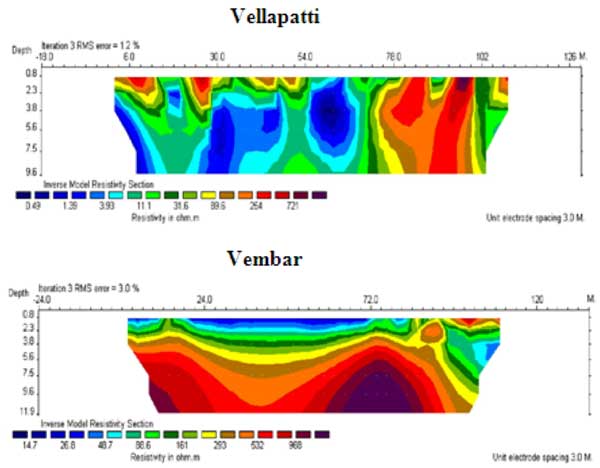
Figure 2.3: 2D Electrical resistivity imaging section show the salt and fresh water interphase at South Narippaiyur, Mookkaiyur, Vellapatti and Vembar.
Results and Discussion
When we analyze the result of the electrical resistivity survey, it is common practice to ensure the relationship between the fresh, brackish and saline water within the coastal aquifer (Mills et al. 1988, Ebraheem et al. 1997, Antony Ravindran et al. 2011). The study (figure 2.3) is neither completely silicic nor carbonate rocks, the beach rocks are mainly constituted with calcareous sandstone or calcarenite and beach sediments. The range of resistivity values with equivalent of Total Dissolved Solids (TDS) concentration for fresh water (> 100- 400 ppm- Calcareous Sedimentary Rocks -25 to 200 ohm-m), brackish water (400-7500 ppm – 7 to 25 ohm-m) and saline water (7500-30000 ppm – 1 to 7 ohm-m) are recorded in the study area. From the range of resistivity values the overburden rock, beach ridge rock (> 200 to 5788 Ohm.m), fresh water, brackish water and saline water (25 to 200 Ohm.m, 7 to 25 Ohm.m,1 to 7 Ohm.m) are delineated.
The resistivity values that ranges from 25 Ohm.m to 200 Ohm.m is identified as a freshwater zone; for the brackish water zone the range of resistivity varies from 7 Ohm.m to 25 Ohm.m and the saline water zone exhibit the resistivity values from 1 to 7 Ohm.m. The dry and overburden beach rocks and beach ridges exhibit the resistivity values > 200 to a maximum of 5788 Ohm.m.
The delineation of saltwater intrusion, freshwater zone and beach ridges are done on the basis of the contour pattern of apparent resistivity values that is reflected in the 2D Electrical Resistivity Images. The distribution pattern of freshwater, saltwater and rocky ridges in the areas of Valinockam, Keelamundal, South-Narippaiyur, Mook-kaiyur, Vellapatti and Vembar are estimated through the Electrical Resistivity Images up to the depth of 11.9 m.The percentage of freshwater aquifer sand area identified in the study area varies from 14% in the South Narippaiyur up to a maximum of 47% at the Valinockam – 3 area. The saltwater aquifer zones also exhibit the variation from a minimum of 10% at Valinockam – 2 to a maximum of 80% at South Narippaiyur. The percentage of beach rock, beach ridges and sandstone varies from the resistivity values form a minimum of 6% of area at South Narippaiyur to a maximum of 63% at Vembar.
The distribution pattern of saltwater intrusion, freshwater and beach rock/sandstone clearly reveals that the increase of the percentage of beach rock decreases the influence of the seawater intrusion. The beach rock and rocky coast acts as dyke rock and disallows the infiltration of the seawater into the coastal aquifer. The lower percentage of sandstone/rocky coast, in the areas of South Narippaiyur, Mookkaiyur and Vellapatti clearly depict the above conclusion as seawater intrusion into the coastal aquifer is evident from the field experiment as well as through the coastal observation of open wells in these areas (Tables 1, 2, 3 and 4).
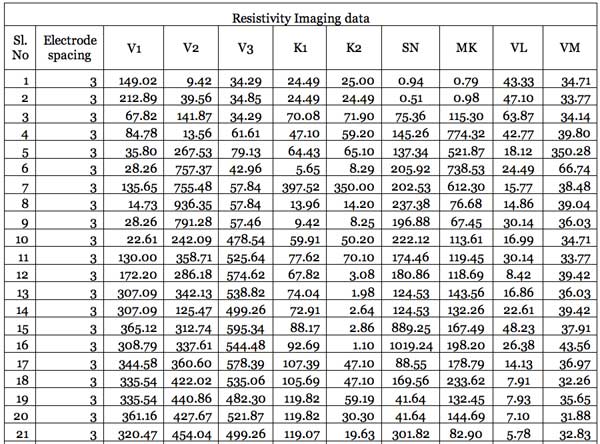
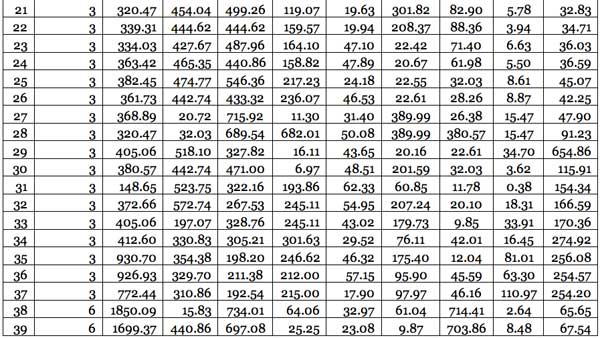
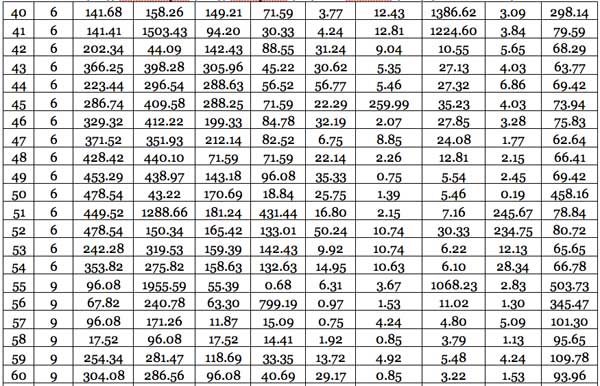
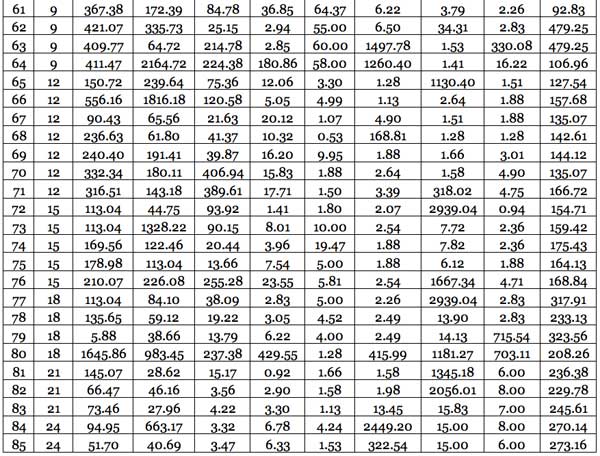
Table 1: Shows the resistivity values and the electrode spacing of the locations of Valinockam-1 (V1), Valinockam-2 (V2), Valinockam-3 (V3), Keelamundal-1(K1), Keelamundal-2 (K2) , South Narippaiyur (SN), Mookkaiyur (MK), Vellapatti (VL) and Vembar (VM).

Table 2: Showing the apparent resistivity equivalent to TDS concentration.

Table 3: Range of resistivity values of the coastal aquifer observed in the areas of Valinockam, Keelamundal, South Narippaiyur, Mookkaiyur, Vellapatti and Vembar.
 fresh water aquifer and salt water aquifer in the study area.")
Table 4: Percentage of sandstone (beach rock, beach ridges etc) fresh water aquifer and salt water aquifer in the study area.
Conclusion
The impact of the tidal and wave energy along the coastal zone is clearly articulated with the advent of the 2D Electrical Resistivity imaging study in the areas of Valinockam, Keelamundal, Narippaiyur, Mookkaiyur, Vellapatti and Vembar in the Northern section. Through this 2D Electrical Resistivity Imaging study the variation of hydraulic conductivity from the high waterline of the beach to a distance of 120m to 240m perpendicular to the coastline in the study area clearly exhibits the saltwater intrusion zone by demarking the low resistivity values from the high resistivity values of various profiles.
At Valinockam terraces, freshwater occurrences are observed from 3m to a maximum depth of 8m. Saltwater zones are encountered from a depth of 7.5 m onwards. The consolidated beach ridge or beach rock in the subsurface zone of the high water line of the beach prevents further intrusion of seawater. The seawater intrusion in Keelamundal region is comparatively higher and traced from the depth of 3.8m onwards. Freshwater lenses are distinguished between the overlying beach rock and underlying saltwater zone. In the areas of South Narippaiyur, Mookkaiyur, Vellapatti and Vembar the sea water intrusion encompass and traces from the depth of 2 m onwards. The detached patches of the sandstone/beach rock in these areas allow intrusion of seawater. Dispersive circulation and different densities of saline and freshwater interaction in the interface is responsible for seawater intrusion.
Apart from these studies the passive characteristic features such as size, shape, roundness, porosity and permeability of the sediments from beaches with different gradients are also to be included. The data collected from the different field viz, sedimentological, hydrological and oceanographic interactions will bring out a unified model of natural beach environments.
The occurrence of seawater at lower depth at Vembar can not be attributed to the phenomena of seawater intrusion as it is mostly due to the low gradient of the area that encounters high wave conditions. The imprints of the high waves and the flushing of seawater back to the sea in these areas reveal the reasons behind the low resistivity values.
Acknowledgements
The first author expresses his sincere thanks to Mr. A.P.C.V. Chockalingam, Secretary and Principal, V.O.C. College, Tuticorin. The help extended by Dr. Boopsingh, Director, Ministry of Earth Science, Department of Science and Technology, Govt of India, New Delhi and carried out in this work are highly acknowledged.
References
Antony Ravindran A., Ramanujam N. and Juliya Damaris D., (2012) Continuous Monitoring of Salinity Structures and Coastal Environmental Study Using 2D –ERI in Vellappatti Beach, Thoothukudi, Tamilnadu. Global Advanced Research Journal of Geography and Regional Planning. Vol. 1(3) pp. 038-044.
Antony Ravindran A., (2010). Charac-terization of geology of subsurface shallow conglomerate using 2D Electrical Resistivity Imaging at Baragadi. Panna District, Madyapradesh, India. Jour. App. Science and Env. Manag. (JASEM), 14.(3);33-36.
Antony Ravindran A. and Ramanujam N., (2012) A case study of crystalline limestone intrusion and fault zone identication using 2d eri technique in Ramco cements, pandalgudi mines, Tamilnadu. International Research Journal of Geology and Mining (IRJGM) (2276-6618) Vol. 2: 011-015.
Antony Ravindran A. and Ramanujam N., Manimaran G. and Manimaran D., (2011). Exploration of Freshwater Movement in Palaeo River and Coastal Environmental Study Using 2D ERI Study in Zirconium Complex, Atomic Energy, Pazhayakayal, Thoothukudi. Research Journal of Earth Sciences 3 (2): 57-62.
Ebraheem A. M., Senosy M. M., and. Dahab K.A., (1997). Geo-electrical and hydrogeochemical studies for delineating ground-water contamination due to salt-water intrusion in the northern part of the Nile Delta, Egypt. Ground Water 35, No. 2, pp. 216–222.
Lusczynski N.J., and Swarzenski W.V., (1966). Salt-water encroachment in south-ern Nassau and southeastern Queens counties Long Island N. Y. USGS Water Supply Paper, 1613-F.
Mills T., Hoekstra P., Blohm M., and Evans L., (1988). Time domain electromagnetic soundings for mapping sea-water intrusion in Monterey County, California. Ground Water 26, pp. 771–782.
Post V. E. A. (2005) Fresh and saline groundwater interaction in coastal aquifers: is our technology ready for the problems ahead?” Hydrogeology Journal. Vol. 13, no. 1, pp. 120–123.
Sonenshein R. S., (1997). Delineation and extent of saltwater intrusion in the Biscayne aquifer, eastern Dade County, Florida, 1995: U.S. Geological Survey Water-Resources Investigations Report 96-4285.
Stewart M. T., (1999). “Geophysical Invest-igations”. in Bear, Jacob, and others, Eds., Seawater Intrusion in Coastal Aquifers – Concepts, Methods and Practices, Dordrecht, The Netherlands, Kluwer Academic Publishers, pp. 9-50.
Sudo H., Tanaka T., Kobayashi T., Kondo T., Takahashi T., Miyamoto M., and Amagai M., (2004). Permeability Imaging in Granitic Rocks Based on Surface Resistivity Profiling. Exploration Geophysics, 35, pp. 56-61.
Vacher H.L., (1988). Ground water in barrier islands – Theoretical analysis and evaluation of the unequal-sea level problem. Journal of Coastal Research, 4(1), 139-148.
Voeikov VL and Del Giudice, (2009) Water Respiration – The Basis of the Living State. Water Journal. Vol.1, p. 52-75.
Zohdy A.A.R., P. Martin., and R.J. Bisdorf., (1993). A study of seawater intrusion using directcurrentsoundings in the southeastern part of the Oxnard Plain, California. Open- File Report 93-524. U.S. Geological Survey, pp. 139.