
 Domains Formation Mediated by Electromagnetic Fields in Very Dilute Aqueous Solutions: 2. Quantum Electrodynamic Analyses of Experimental Data on Strong Electrolyte Solutions
Yinnon TA1*, Liu ZQ2
1 K. Kalia, D.N. Kikar Jordan 90666, Israel
2 Department of Physics Qufu Normal University, Qufu, 273165, China
*Correspondence E-mail: lwcdsrc@kalia.org.il
Key Words: Water aggregates; molecular associates; domains; ferroelectric orderings; polar liquid solutions; ultra dilute solutions; serial diluted solutions; strong electrolyte solutions.
Received Jan 15th 2015; Revised June 4th; Accepted June 30th; Published Sep 15th; Available online Oct 27th, 2015
Abstract
(This is the second part of a three-part series.)
Molecular associates in aqueous solutions of strong electrolytes are analyzed. The solutions’ concentrations (C) were in the range of 2 – 10-20 M. Preparation of the solutions involved serial dilutions of a stock solution and vigorous shaking after each dilution step. Electromagnetic fields were observed to mediate formation of some associate types. Screening ambient electromagnetic fields by placing the solutions in Permalloy containers destroyed these associates. Therefore we carry out our analyses with a model explicitly describing electrodynamic interactions. Our analyses show: (i) The 10-7 – 10-4 m sized associates observed by light scattering, atomic force microscopy and other techniques, have the typical characteristics predicted by the model. (ii) Electromagnetic fields mediate formation of: (a) 10-5 – 10-4 m sized associates mainly composed of ferroelectric ordered water molecules, present at solute dependent C ranges (typically C<10-7 M); (b) 10-7 m sized associates composed of electronically excited water molecules. (iii) The prerequisites of serial dilutions and vigorous shaking for stabilizing associates at C<10-7 M are clarified.
Article Outline
- Introduction
- Theory
- Results and Discussion
- Conclusions
- Acknowledgements
- References
- Discussion with Reviewers
Introduction
During the last two decades, water molecules (H2O) and solvated strong electrolytes associating spontaneously in aqueous solutions unambiguously have been observed by light scattering and electron microscopy (Lo, 1996a; Li and Ogawa, 2000; Georgalis et al., 2000; Samal and Geckeler, 2001; Sedlak, 2006; Ryzhkina et al., 2012). The molecular association is not due to nano-bubbles (Sedlak and Rak, 2013). These are 10-7 – 10-4 m sized groupings consisting of numerous H2O and some solvated ions. The research group of Konovalov was the first to discover that ambient electromagnetic fields (EMF) affect the groupings (Ryzhkina et al., 2012; for review see Konovalov and Ryzhkina, 2014). They showed that storing samples of aqueous NaCl under hypo electromagnetic conditions, i.e., in a Permalloy container with residual field of 10 nano Tesla, affect prevalence of the various types of groupings and their impact on electric conductivity.
Elia and Niccoli (1999, 2000, 2004a) with calorimetric, electric conductivity and pH measurements were the first to reveal supramolecular orderings in solutions prepared by up to 30 times serial centesimal diluting a 1% weight/volume stock aqueous NaCl solution (for review see Elia and Germano, 2015). They showed that whenever at each centesimal dilution step the samples are not vigorously succussed, these do not contain such orderings for C below a critical concentration (Ccrit); typically 10-8 M < Ccrit <10-6 M. Stabilization of the molecular groupings occurs during about 1-18 hours after preparation of the serial diluted vigorous shaken aqueous strong electrolyte solution (SDVSASES). a
aSDVSASES preparation involves serial decimal or centesimal diluting a “stock” solution. SDVSASES are prepared with freshly doubly distilled water or water purified by Simplicity®Water Purification Systems – Millipore. The electrical conductivity of these waters is below 1.5 μS/cm. Dust is removed. The stock solution is analyzed for absence of impurities. C of stock solutions are in the 4 M – 10-3 M range. After each dilution step, SDVSASES are vigorous shaken, e.g., with lab dancer shaker, by vertical vortexing or other methods. Plastic or glass vessels are used. Temperature and pressure are kept constant, typically, respectively, at 298 K and about 1 atmosphere. As controls, water is serial diluted and shaken after each dilution step, with all experimental parameters identical to those of SDVSASES preparation.
Impurities released by containers affect SDVSASES but cannot account for their typical properties. Elia and Niccoli (2004a, 2004b) used dark glass as well as laboratory glass bottles. The former but not the latter release significant amounts of alkaline oxide and silica. They showed for SDVSASES of NaCl with C below about 10-8 M their heat of mixing with NaOH and their electric conductivity differ from the controls, i.e., from solutions with equivalent chemical composition prepared without vigorous shaking.Konovalov, Ryzhkina and co-workers [Arbuzov Institute at Kazan Scientific Center — Russian Federation (private discussions)] observed electric conductivity is higher for 10-20 M < C < 10-2 M SDVSASES prepared with glass utensils than with plastic ones. However, the typical features (e.g., extremums) in SDVSASES electric conductivity’s dependence on concentration are similar. The similarity indicates that impurities released by glass utensils affect these liquids’ physicochemical variables’ value (e.g., raise electric conductivity) but do not alter their associate types.
Ambient EMF majorly affecting selforganization of molecules in SDVSASES indicates explaining their properties necessitates electrodynamic theory. The quantum electrodynamic (QED) model for SDVSASES proposed by Yinnon and Yinnon (2011) has provided consistent explanations for various phenomena, e.g., SDVSASES ‘s electric conductivity, heat of mixing and their dependence on time and volume (Yinnon and Elia, 2013).
The original lack of insight into the nature of the molecular associates, e.g., the forces underlying their formation and their sizes, instigated labeling these as supramolecular orderings, clusters, nano-associates or nano-particles. Their recent unveiled properties render these terms inappropriate b. In particular because of ultraviolet (UV), visible or Infra Red (IR) EMF mediating attraction between 10-7 or 10-4 – 10-5 m distanced molecules in the associates, we propose designating these “domains” – a term concurrent with that used by the physicist who predicted their existence.
bAccording to the customary chemical nomenclature, supramolecular orderings refer to definite structures wherein electro-static interactions ‘glue’ the molecules together, with EMF not known to play significant roles. Clusters typically refer to small groupings consisting of up to a few hundred molecules. The 10-7 m groupings indeed are very large nano-groupings, but it is more appropriate to denote the 10-6 – 10-5 m ones as ‘micro-groupings’.
Our goals are:
a) Employing the QED model for SDVSASES for explaining recently observed (and to the best of our knowledge yet unexplained) characteristics of the various domain types present in these liquids.
b) Elucidating the domains’ impacts on some of these liquids’ properties, e.g., their spectra and electric conductivities. These elucidations complement earlier ones reported in Yinnon and Yinnon (2011) and Yinnon and Elia (2013).
The outline of the paper is as follows: firstly, in the Theory section we concisely summarize the SDVSASES model. Next in the Discussion section, we show that recently measured properties of SDVSASES conform to those predicted by the model. Since QED of aqueous solutions hitherto mainly has been employed for explaining special phenomena, many readers may be unfamiliar with it. Therefore, its aspects relevant to our analyses we concisely summarized in the paper preceding this one in this journal’s issue (Yinnon and Liu, 2015a). We stress we do not present any new experimental results — our analyses pertain to previous reported experimental data. A list with abbreviations is presented at the end of this paper. As to the importance of our goals, SDVSASES have implications for numerous technologies.
3Del Giudice et al. (1988, 2000), Preparata (1995 Chapters 1-3,5,10) and Arani et al. (1995) with QED identified several instabilities in water and its solutions, which may lead to liquid-liquid phase transitions. Interactions between EMF and matter fields may cause 106 – 1018 H2O together with few solutes to organize in domains wherein the photons mediating their attractions are condensed. The domains’ characteristics conform to those of aqueous solutions’ 10-7-10-4 m groupings (Yinnon and Yinnon, 2009, 2011, 2012; Yinnon and Elia, 2013).
Theory
Customary models of aqueous strong electrolyte solutions predict: EMF, serial dilutions or vigorous shaking do not affect their characteristics; solvated solutes distribute homogenously, move independently and randomly; H2O (except solvation shells’ H2O) move randomly and form flickering hydrogen-bond networks (Horne, 1971; Robinson and Stokes, 2002). These customary models explicitly describe electrostatic forces and assume electrodynamic ones can be treated perturbatively. However, QED models explicitly including electrodynamic forces show EMF interactions with H2O or with ions, for solute type dependent C ranges, may lead to formation of various QED domain types (Del Giudice, 1988, 1998, 2000; Arani et al., 1995; Preparata, 1995 chapters 2, 5, 10; Yinnon and Yinnon, 2012). Based on formal QED theory descriptions of aqueous systems, the conditions for formation of these domains and their properties were ab initio derived.
These domains were generally labeled “CD” – a shortening for “coherence domains” [see Yinnon and Liu (2015a) for explanation of this labeling]. CD may agglomerate into supra-domains (supra-CD). Supra-CD are not ensembles of molecules but agglomerates of domains, like domains in liquid crystals.
Coherence Domains — The various QED domain types hitherto identified, which are in detail described and schematically pictured by Yinnon and Liu (2015a), include:
• CDrot — these domains are composed of ferroelectric ordered H2O. These H2O coherently oscillate between two rotational states. CDrot formation results from the dipole moments of their H2O interacting with IR EMF. CDrot have an electric dipole moment due to the ferroelectric ordering of their H2O. In bulk water at ambient conditions, CDrot do not auto-organize. However, immersing objects with sizable asymmetric charge distributions (e.g., macromolecules, hydrophylic membranes) may induce their formation. Their presence induces a permanent time dependent polarization. Solutes are pulled into CDrot. Few solute particles can locate in CDrot and do not wreck their host. Many solute molecules destroy CDrot. Solute type determines critical C below which CDrot persist (![]() ). CDrot’s diameter is of the order of ~10-4 – 10-5 m.
). CDrot’s diameter is of the order of ~10-4 – 10-5 m.
• CDplasma — these domains are composed of few solvated ions and numerous H2O. The plasma oscillations of these ions are coherent. Interactions between the ions and tetra Herz to mega Herz EMF underlie the coherence. CDplasma are very stable domains. Energy gained by an ion on its incorporation in CDplasma amounts to a few eV. In aqueous strong electrolyte solutions, CDplasma form at all concentrations above the transition concentration ![]() . [This is not the case for aqueous solutions of weak electrolytes, as discussed in the subsequent paper (Yinnon and Liu, 2015b).]
. [This is not the case for aqueous solutions of weak electrolytes, as discussed in the subsequent paper (Yinnon and Liu, 2015b).] ![]() is the concentration at which the distance between identical nearest neighbor ions equals the Debye length. For monovalent electrolytes
is the concentration at which the distance between identical nearest neighbor ions equals the Debye length. For monovalent electrolytes ![]() = 2.1 x 10⁻⁴ M (Yinnon and Yinnon, 2012). The diameter of CDplasma is of the order of 10-6 m. It is an inverse function of concentration, i.e., when the concentration decreases the size of CDplasma increases, the number of its solvated solutes diminishes and the number of its H2O enhances.
= 2.1 x 10⁻⁴ M (Yinnon and Yinnon, 2012). The diameter of CDplasma is of the order of 10-6 m. It is an inverse function of concentration, i.e., when the concentration decreases the size of CDplasma increases, the number of its solvated solutes diminishes and the number of its H2O enhances.
• IPDplasma — these domains are composed of few solvated ions and numerous H2O. The plasma oscillations of these ions are in phase i.e., an IPDplasma is a special CD — an In-Phase Domain. Also the plasma oscillations of their H2O are in phase. Interactions between its molecules and tetra Herz to mega Herz EMF underlie all these in phase plasma oscillations. IPDplasma are crystalline structured. The dipole moments of their H2O are spherical symmetric aligned around their crystalline structured solvated ions. IPDplasma are very stable domains, slightly more stable than CDplasma. IPDplasma form at concentrations below ![]() . On diluting below
. On diluting below ![]() , CDplasma transform into IPDplasma, i.e., the coherent plasma oscillations of the domains’ solvated ions become in phase. The diameter of IPDplasma equals that of CDplasma at
, CDplasma transform into IPDplasma, i.e., the coherent plasma oscillations of the domains’ solvated ions become in phase. The diameter of IPDplasma equals that of CDplasma at ![]() , i.e., about 10-6 m. In contrast to the case for CDplasma, the diameter of IPDplasma does not significantly change with concentration. On diluting solutions below
, i.e., about 10-6 m. In contrast to the case for CDplasma, the diameter of IPDplasma does not significantly change with concentration. On diluting solutions below ![]() , the number of IPDplasma diminishes.
, the number of IPDplasma diminishes.
• ![]() — these domains are composed of H2O only.
— these domains are composed of H2O only. ![]() cannot contain solutes. Solvated solutes, CDplasma or IPDplasma locate adjacent to
cannot contain solutes. Solvated solutes, CDplasma or IPDplasma locate adjacent to ![]() . The H2O constituting
. The H2O constituting ![]() coherently oscillate between their electronic ground state |0⟩ and an excited |b⟩ state.
coherently oscillate between their electronic ground state |0⟩ and an excited |b⟩ state. ![]() formation is mediated by UV EMF. One electron of an H2O residing in its |b⟩ state is almost free (binding energy of about 0.4 eV). Hence, a
formation is mediated by UV EMF. One electron of an H2O residing in its |b⟩ state is almost free (binding energy of about 0.4 eV). Hence, a ![]() is a pool of ~106 quasi free electrons and quasi free protons. At ambient conditions, in bulk water: the fraction of H2O included in
is a pool of ~106 quasi free electrons and quasi free protons. At ambient conditions, in bulk water: the fraction of H2O included in ![]() is about 20 percent; H2O continually adsorb on
is about 20 percent; H2O continually adsorb on ![]() while simultaneously H2O desorb, causing a ~10-14 s timescale flickering landscape. Thus
while simultaneously H2O desorb, causing a ~10-14 s timescale flickering landscape. Thus ![]() observation requires fast resolution probes. CDrot, CDplasma and IPDplasma may stabilize
observation requires fast resolution probes. CDrot, CDplasma and IPDplasma may stabilize ![]() i.e., reduce their flickering and ease their observation.
i.e., reduce their flickering and ease their observation. ![]() and supra-
and supra-![]() may get encapsulated in CDrot and supra-CDrot. Such assemblies we denote [supra-CDrot]. The state of H2O belonging to both CDrot and
may get encapsulated in CDrot and supra-CDrot. Such assemblies we denote [supra-CDrot]. The state of H2O belonging to both CDrot and ![]() is a superposition of the state typifying the H2O constituting CDrot and the state typifying the H2O constituting
is a superposition of the state typifying the H2O constituting CDrot and the state typifying the H2O constituting ![]() . The diameter of is ~10-7 m.
. The diameter of is ~10-7 m.
Superfluidic CD — CDrot, IPDplasma and ![]() are superfluidic domains, i.e., their molecules do not collide (see Yinnon and Liu, 2015a). CDplasma are not superfluidic. The superfluidity of CD has implications for the liquid’s properties, e.g., its electric conductivity.
are superfluidic domains, i.e., their molecules do not collide (see Yinnon and Liu, 2015a). CDplasma are not superfluidic. The superfluidity of CD has implications for the liquid’s properties, e.g., its electric conductivity.
Schematic pictures of aqueous strong electrolyte solution — Figures 1 ia-iia communicate that for concentration above ![]() , part of the solvated ions move randomly and part are organized in CDplasma. Moreover these show
, part of the solvated ions move randomly and part are organized in CDplasma. Moreover these show ![]() and supra-
and supra-![]() are stabilized by CDplasma. Comparing Figure 1ia and Figure 1iia highlights that the diameter of CDplasma increases on dilution. While on dilution a larger fraction of the solutes incorporate in CDplasma, the increase in these domains’ diameter mainly is due to incorporation of larger numbers of H2O. Figure 1iia and Figure 1iiia exhibit the transition of CDplasma into IPDplasma. On comparing Figure 1iiia, Figure 1iva and Figure 1va, one discerns that the diameter of IPDplasma does not significantly change with concentration. Instead on diluting, the number of IPDplasma diminishes. Figures 1 via-viiia illustrate that in very diluted solutions IPDplasma do not form and all solvated solutes locate randomly.
are stabilized by CDplasma. Comparing Figure 1ia and Figure 1iia highlights that the diameter of CDplasma increases on dilution. While on dilution a larger fraction of the solutes incorporate in CDplasma, the increase in these domains’ diameter mainly is due to incorporation of larger numbers of H2O. Figure 1iia and Figure 1iiia exhibit the transition of CDplasma into IPDplasma. On comparing Figure 1iiia, Figure 1iva and Figure 1va, one discerns that the diameter of IPDplasma does not significantly change with concentration. Instead on diluting, the number of IPDplasma diminishes. Figures 1 via-viiia illustrate that in very diluted solutions IPDplasma do not form and all solvated solutes locate randomly.
 and (b) pertain to solutions which, respectively, were not vigorously shaken and those which were vigorously shaken after each dilutions step. Tiny blue balls represent randomly moving ~10-9 m solvated ions. Yellow-brown balls and their agglomerates represent, respectively, ~10-7 m and supra-. Figures ia and iia illustrate that on dilution the diameter of CDplasma (symbolized with purple-blue colored balls) increases and the fraction of randomly moving solvated solutes diminishes. Figures iia and iiia illustrate the transformation of CDplasma into IPDplasma at C=≈10-4 M. Note that the diameter of IPDplasma is that of CDplasma at C=. Figures iiia-va illustrate that on dilution the diameter of IPDplasma does not change, but the number of IPDplasma diminishes. Figures via-viiia illustrate that below a certain concentration there are insufficient solutes to form IPDplasma. The concentrations below which no IPDplasma form has yet not been theoretically derived. Figures via-viiia illustrate that whenever there are too few ions to form IPDplasma, the solution has the characteristics predicted by the customary models, i.e., all solvated electrolytes move randomly and their number diminishes on dilution. In the Figure 1b series, the blue zigzag curves symbolize shaken excites or cracks domains. Figures ib and iib illustrate that excitations or cracking does not significantly alter the internal structure of CDplasma, which just as in Figure 1a series are represented with purple-blue colored balls. Figures iib and iiib illustrate the transition from CDplasma to IPDplasma, with the latter pictured as blue-crystalline balls just as in the (a) series. Figures iiib and ivb illustrate that shaking excites or breaks up IPDplasma. The excited or broken IPDplasma pieces, which in the text we denoted electric dipole aggregate (EDAIPDplasma), are pictured as irregular shaped aggregates in (ivb). The aligned black arrows orderings in EDAIPDplasma symbolize these domains’ distorted ferroelectric H2O orderings. The purple arrows in the EDAIPDplasma symbolizes these domains’ dipole moments. Figures ivb and vb illustrate that on diluting below a critical concentration CDrot get stabilized by EDAIPDplasma, i.e., the irregular shaped EDAIPDplasma are located within the elongated ovals representing CDrot. The mechanism underlying stabilization of CDrot by EDAIPDplasma is explained in the text. The dark blue arrows symbolize the dipole moment of CDrot. Figure vib shows that vigorous shaking excites or breaks up CDrot. The excited or broken CDrot pieces, which in the text we denoted electric dipole aggregate (EDACDrot), are outlined with an irregular shaped broken line, e.g., the chunk located at the bottom of the CDrot to the left in Figure vib. Figures vib-viib show that at certain concentrations both EDAIPDplasma and EDACDrot are present within CDrot, though the sizes of EDAIPDplasma diminish with concentration. Figures viiib shows that on diluting further, no EDAIPDplasma persist, i.e., there are too few solute particles to sustain EDAIPDplasma. At these concentrations, vigorous shaking just breaks up CDrot and creates new EDACDrot. These in turn stabilize new CDrot, as pictured in Figure viiib. Figures vb-viib illustrate that CDrot may align with their dipole moments parallel. Figure viiib illustrates that at certain concentrations their dipoles may be aligned anti-parallel. Note that the sizes of the various domains, their broken pieces and the sizes of the solvated solutes with their hydration shells are not presented according to their realistic scale ratios.")
 and (b) pertain to solutions which, respectively, were not vigorously shaken and those which were vigorously shaken after each dilutions step. Tiny blue balls represent randomly moving ~10-9 m solvated ions. Yellow-brown balls and their agglomerates represent, respectively, ~10-7 m and supra-. Figures ia and iia illustrate that on dilution the diameter of CDplasma (symbolized with purple-blue colored balls) increases and the fraction of randomly moving solvated solutes diminishes. Figures iia and iiia illustrate the transformation of CDplasma into IPDplasma at C=≈10-4 M. Note that the diameter of IPDplasma is that of CDplasma at C=. Figures iiia-va illustrate that on dilution the diameter of IPDplasma does not change, but the number of IPDplasma diminishes. Figures via-viiia illustrate that below a certain concentration there are insufficient solutes to form IPDplasma. The concentrations below which no IPDplasma form has yet not been theoretically derived. Figures via-viiia illustrate that whenever there are too few ions to form IPDplasma, the solution has the characteristics predicted by the customary models, i.e., all solvated electrolytes move randomly and their number diminishes on dilution. In the Figure 1b series, the blue zigzag curves symbolize shaken excites or cracks domains. Figures ib and iib illustrate that excitations or cracking does not significantly alter the internal structure of CDplasma, which just as in Figure 1a series are represented with purple-blue colored balls. Figures iib and iiib illustrate the transition from CDplasma to IPDplasma, with the latter pictured as blue-crystalline balls just as in the (a) series. Figures iiib and ivb illustrate that shaking excites or breaks up IPDplasma. The excited or broken IPDplasma pieces, which in the text we denoted electric dipole aggregate (EDAIPDplasma), are pictured as irregular shaped aggregates in (ivb). The aligned black arrows orderings in EDAIPDplasma symbolize these domains’ distorted ferroelectric H2O orderings. The purple arrows in the EDAIPDplasma symbolizes these domains’ dipole moments. Figures ivb and vb illustrate that on diluting below a critical concentration CDrot get stabilized by EDAIPDplasma, i.e., the irregular shaped EDAIPDplasma are located within the elongated ovals representing CDrot. The mechanism underlying stabilization of CDrot by EDAIPDplasma is explained in the text. The dark blue arrows symbolize the dipole moment of CDrot. Figure vib shows that vigorous shaking excites or breaks up CDrot. The excited or broken CDrot pieces, which in the text we denoted electric dipole aggregate (EDACDrot), are outlined with an irregular shaped broken line, e.g., the chunk located at the bottom of the CDrot to the left in Figure vib. Figures vib-viib show that at certain concentrations both EDAIPDplasma and EDACDrot are present within CDrot, though the sizes of EDAIPDplasma diminish with concentration. Figures viiib shows that on diluting further, no EDAIPDplasma persist, i.e., there are too few solute particles to sustain EDAIPDplasma. At these concentrations, vigorous shaking just breaks up CDrot and creates new EDACDrot. These in turn stabilize new CDrot, as pictured in Figure viiib. Figures vb-viib illustrate that CDrot may align with their dipole moments parallel. Figure viiib illustrates that at certain concentrations their dipoles may be aligned anti-parallel. Note that the sizes of the various domains, their broken pieces and the sizes of the solvated solutes with their hydration shells are not presented according to their realistic scale ratios.")
Figure 1: This figure presents a schematic picture of serial diluted strong electrolyte solutions. The series in Figures 1(a) and (b) pertain to solutions which, respectively, were not vigorously shaken and those which were vigorously shaken after each dilutions step. Tiny blue balls represent randomly moving ~10-9 m solvated ions. Yellow-brown balls and their agglomerates represent, respectively, ~10-7 m ![]() and supra-
and supra-![]() . Figures ia and iia illustrate that on dilution the diameter of CDplasma (symbolized with purple-blue colored balls) increases and the fraction of randomly moving solvated solutes diminishes. Figures iia and iiia illustrate the transformation of CDplasma into IPDplasma at C=
. Figures ia and iia illustrate that on dilution the diameter of CDplasma (symbolized with purple-blue colored balls) increases and the fraction of randomly moving solvated solutes diminishes. Figures iia and iiia illustrate the transformation of CDplasma into IPDplasma at C=![]() ≈10-4 M. Note that the diameter of IPDplasma is that of CDplasma at C=
≈10-4 M. Note that the diameter of IPDplasma is that of CDplasma at C=![]() . Figures iiia-va illustrate that on dilution the diameter of IPDplasma does not change, but the number of IPDplasma diminishes. Figures via-viiia illustrate that below a certain concentration there are insufficient solutes to form IPDplasma . The concentrations below which no IPDplasma form has yet not been theoretically derived. Figures via-viiia illustrate that whenever there are too few ions to form IPDplasma , the solution has the characteristics predicted by the customary models, i.e., all solvated electrolytes move randomly and their number diminishes on dilution. In the Figure 1b series, the blue zigzag curves symbolize shaken excites or cracks domains. Figures ib and iib illustrate that excitations or cracking does not significantly alter the internal structure of CDplasma, which just as in Figure 1a series are represented with purple-blue colored balls. Figures iib and iiib illustrate the transition from CDplasma to IPDplasma , with the latter pictured as blue-crystalline balls just as in the (a) series. Figures iiib and ivb illustrate that shaking excites or breaks up IPDplasma . The excited or broken IPDplasma pieces, which in the text we denoted electric dipole aggregate (EDAIPDplasma), are pictured as irregular shaped aggregates in (ivb). The aligned black arrows orderings in EDAIPDplasma symbolize these domains’ distorted ferroelectric H2O orderings. The purple arrows in the EDAIPDplasma symbolizes these domains’ dipole moments. Figures ivb and vb illustrate that on diluting below a critical concentration CDrot get stabilized by EDAIPDplasma, i.e., the irregular shaped EDAIPDplasma are located within the elongated ovals representing CDrot. The mechanism underlying stabilization of CDrot by EDAIPDplasma is explained in the text. The dark blue arrows symbolize the dipole moment of CDrot. Figure vib shows that vigorous shaking excites or breaks up CDrot. The excited or broken CDrot pieces, which in the text we denoted electric dipole aggregate (EDACDrot), are outlined with an irregular shaped broken line, e.g., the chunk located at the bottom of the CDrot to the left in Figure vib. Figures vib-viib show that at certain concentrations both EDAIPDplasma and EDACDrot are present within CDrot, though the sizes of EDAIPDplasma diminish with concentration. Figures viiib shows that on diluting further, no EDAIPDplasma persist, i.e., there are too few solute particles to sustain EDAIPDplasma. At these concentrations, vigorous shaking just breaks up CDrotand creates new EDACDrot. These in turn stabilize new CDrot, as pictured in Figure viiib. Figures vb-viib illustrate that CDrot may align with their dipole moments parallel. Figure viiib illustrates that at certain concentrations their dipoles may be aligned anti-parallel. Note that the sizes of the various domains, their broken pieces and the sizes of the solvated solutes with their hydration shells are not presented according to their realistic scale ratios.
. Figures iiia-va illustrate that on dilution the diameter of IPDplasma does not change, but the number of IPDplasma diminishes. Figures via-viiia illustrate that below a certain concentration there are insufficient solutes to form IPDplasma . The concentrations below which no IPDplasma form has yet not been theoretically derived. Figures via-viiia illustrate that whenever there are too few ions to form IPDplasma , the solution has the characteristics predicted by the customary models, i.e., all solvated electrolytes move randomly and their number diminishes on dilution. In the Figure 1b series, the blue zigzag curves symbolize shaken excites or cracks domains. Figures ib and iib illustrate that excitations or cracking does not significantly alter the internal structure of CDplasma, which just as in Figure 1a series are represented with purple-blue colored balls. Figures iib and iiib illustrate the transition from CDplasma to IPDplasma , with the latter pictured as blue-crystalline balls just as in the (a) series. Figures iiib and ivb illustrate that shaking excites or breaks up IPDplasma . The excited or broken IPDplasma pieces, which in the text we denoted electric dipole aggregate (EDAIPDplasma), are pictured as irregular shaped aggregates in (ivb). The aligned black arrows orderings in EDAIPDplasma symbolize these domains’ distorted ferroelectric H2O orderings. The purple arrows in the EDAIPDplasma symbolizes these domains’ dipole moments. Figures ivb and vb illustrate that on diluting below a critical concentration CDrot get stabilized by EDAIPDplasma, i.e., the irregular shaped EDAIPDplasma are located within the elongated ovals representing CDrot. The mechanism underlying stabilization of CDrot by EDAIPDplasma is explained in the text. The dark blue arrows symbolize the dipole moment of CDrot. Figure vib shows that vigorous shaking excites or breaks up CDrot. The excited or broken CDrot pieces, which in the text we denoted electric dipole aggregate (EDACDrot), are outlined with an irregular shaped broken line, e.g., the chunk located at the bottom of the CDrot to the left in Figure vib. Figures vib-viib show that at certain concentrations both EDAIPDplasma and EDACDrot are present within CDrot, though the sizes of EDAIPDplasma diminish with concentration. Figures viiib shows that on diluting further, no EDAIPDplasma persist, i.e., there are too few solute particles to sustain EDAIPDplasma. At these concentrations, vigorous shaking just breaks up CDrotand creates new EDACDrot. These in turn stabilize new CDrot, as pictured in Figure viiib. Figures vb-viib illustrate that CDrot may align with their dipole moments parallel. Figure viiib illustrates that at certain concentrations their dipoles may be aligned anti-parallel. Note that the sizes of the various domains, their broken pieces and the sizes of the solvated solutes with their hydration shells are not presented according to their realistic scale ratios.
SDVSASES’s QED model
Figures 1 ib-viiib present a schematic picture of our SDVSASES model, i.e., the structure of SDVSASES for different concentration ranges. Its details we discuss in the following paragraphs. The differences between Figure 1’s (a) versus (b) series, is that the latter refer to solutions which were vigorously shaken after each dilution step, while the former were not vigorously shaken.
i. For C>![]() , CDplasma coexist with randomly located solvated electrolyte ions — see Figure ib and iib. The fraction of solutes and H2O incorporated within CDplasma, the diameter of CDplasma, and agglomeration of CDplasma into supra-CDplasma increase on dilution (compare Figure 1 ib with iib).
, CDplasma coexist with randomly located solvated electrolyte ions — see Figure ib and iib. The fraction of solutes and H2O incorporated within CDplasma, the diameter of CDplasma, and agglomeration of CDplasma into supra-CDplasma increase on dilution (compare Figure 1 ib with iib). ![]() stabilize and may form supra-
stabilize and may form supra-![]() when their plasma oscillations resonate with those of CDplasma. Resonance depends on concentration because the frequency of the plasma oscillations is proportional to C3/4 (see Yinnon and Liu, 2015a). The aforesaid holds for all strong electrolyte solutions, independent of their preparation procedure, i.e., not just for SDVSASES but also for solutions prepared without vigorous shaking or serial dilutions. Serial dilutions or vigorous shaking affect CDplasma, mainly causing their breakup. However, CDplasma reform after perturbations are over, as illustrated in Figures 1 ib and iib.
when their plasma oscillations resonate with those of CDplasma. Resonance depends on concentration because the frequency of the plasma oscillations is proportional to C3/4 (see Yinnon and Liu, 2015a). The aforesaid holds for all strong electrolyte solutions, independent of their preparation procedure, i.e., not just for SDVSASES but also for solutions prepared without vigorous shaking or serial dilutions. Serial dilutions or vigorous shaking affect CDplasma, mainly causing their breakup. However, CDplasma reform after perturbations are over, as illustrated in Figures 1 ib and iib.
ii. At C=![]() , CDplasma transform into IPDplasma (see Figs. 1iia-b and iiia-b). The transition modifies electric conductivity and their dependence on concentration and time, because IPDplasma are superfluidic and crystalline structured. Dilution below
, CDplasma transform into IPDplasma (see Figs. 1iia-b and iiia-b). The transition modifies electric conductivity and their dependence on concentration and time, because IPDplasma are superfluidic and crystalline structured. Dilution below ![]() diminishes the number of randomly moving solvated ions as well as the number of ions incorporated in IPDplasma.
diminishes the number of randomly moving solvated ions as well as the number of ions incorporated in IPDplasma. ![]() stabilize and may form supra-
stabilize and may form supra-![]() when their plasma oscillations resonate with those of IPDplasma. Aforesaid holds for all strong electrolytes solutions, independent of their preparation procedure.
when their plasma oscillations resonate with those of IPDplasma. Aforesaid holds for all strong electrolytes solutions, independent of their preparation procedure.
iii. Vigorous shaking excites or breaks up IPDplasma, as pointed out by Yinnon and Yinnon (2011) (see Figure 1iiib). Excitations induce years-long lasting vortices in the superfluidic IPDplasma (Yinnon and Elia, 2013). [For a short discussion on these vortexes see Yinnon and Liu (2015a).] The vortexes partly destroy the spherical symmetric alignments of the dipole moments of their H2O surrounding their crystalline ordered solvated ions. Hence excited IPDplasma and their broken pieces have electric dipoles, i.e., are electric dipole aggregates, which we denote EDAIPDplasma (see Figure 1ivb). EDAIPDplasma have the remnant crystalline structure of their “mother” IPDplasma (Yinnon and Yinnon, 2011; Yinnon and Elia, 2013). (As for CDplasma, only their solvation shells’ few H2O are aligned, i.e., their perturbation, for example vigorous shaking, does not create 10-6 m-sized electric dipole aggregates.)
iv. EDAIPDplasma induce electric dipoles in the quasi-free electron clouds of ![]() . The interactions between the dipole moments of these clouds, as well as between these and the dipole moments of EDAIPDplasma may stabilize
. The interactions between the dipole moments of these clouds, as well as between these and the dipole moments of EDAIPDplasma may stabilize ![]() and supra-
and supra-![]() (see Figure 1 ivb).
(see Figure 1 ivb).
v. For concentrations less than the critical concentration for CDrot formation (i.e., C<![]() ), due to the interactions between the dipoles of EDAIPDplasma and H2O, EDAIPDplasma stabilize CDrot and supra-CDrot (Yinnon and Yinnon, 2011; Yinnon and Elia, 2013) — see Figure 1vb. In other words, EDAIPDplasma, due to their significant asymmetric charge distributions, stabilize CDrot.
), due to the interactions between the dipoles of EDAIPDplasma and H2O, EDAIPDplasma stabilize CDrot and supra-CDrot (Yinnon and Yinnon, 2011; Yinnon and Elia, 2013) — see Figure 1vb. In other words, EDAIPDplasma, due to their significant asymmetric charge distributions, stabilize CDrot.
Vigorous shaking excites or breaks up CDrot (see Figure 1vib). Excitations induce years-long vortices in the superfluidic CDrot. Due to ferroelectric ordering of the molecules constituting CDrot, excited or broken CDrot also are electric dipole aggregates, i.e., EDACDrot (see Figure 1vib). Unlike EDAIPDplasma, EDACDrot are not crystalline ordered. Due to interactions between the dipoles of EDACDrot and H2O, EDACDrot also stabilize CDrot. Therefore, serial dilutions with vigorous shaking at each dilution step diminish EDAIPDplasma but EDACDrot persist. These EDACDrot stabilize CDrot and supra-CDrot too. As a result CDrot persist up to ultra low concentrations and beyond (Yinnon and Yinnon, 2011; Yinnon and Elia, 2013) (see Figures 1vib-viiib).
vi. CDrot induce electric dipoles in the quasi free electron clouds of ![]() . The interactions between the dipole moments of these clouds, as well as between these and the dipole moments of CDrot or EDACDrot may stabilize
. The interactions between the dipole moments of these clouds, as well as between these and the dipole moments of CDrot or EDACDrot may stabilize ![]() and supra-
and supra-![]() (see Figure 1vb) (Del Giudice et al., 2010).
(see Figure 1vb) (Del Giudice et al., 2010).
vii. QED domains affect physicochemical properties, requiring adjustment in customary equations, e.g., that of electric conductivity (Yinnon and Yinnon, 2012). H2O incorporated in ![]() , in CDrot, in IPDplasma or in the hydration shells of ions in CDplasma do not collide. Also ions incorporated in CDplasma or IPDplasma do not collide. Hence in aqueous solutions of strong electrolytes, the electric conductivity is an inverse function only of intermolecular collisions involving: the randomly moving H2O not included in the domains; randomly moving solvated ions which are not incorporated in CDplasma; H2O incorporated in CDplasma but not part of the solvation shells of the ions included in these domains. A decrease of the fractions of these colliding particles enhances the electric conductivity. Also the electric dipole moments of EDAIPDplasma, of CDrot, of EDACDrot and of the quasi free electron clouds of
, in CDrot, in IPDplasma or in the hydration shells of ions in CDplasma do not collide. Also ions incorporated in CDplasma or IPDplasma do not collide. Hence in aqueous solutions of strong electrolytes, the electric conductivity is an inverse function only of intermolecular collisions involving: the randomly moving H2O not included in the domains; randomly moving solvated ions which are not incorporated in CDplasma; H2O incorporated in CDplasma but not part of the solvation shells of the ions included in these domains. A decrease of the fractions of these colliding particles enhances the electric conductivity. Also the electric dipole moments of EDAIPDplasma, of CDrot, of EDACDrot and of the quasi free electron clouds of ![]() reduce intermolecular collisions of randomly moving H2O neighboring on these domains. The reduction raises electric conductivity (Yinnon and Yinnon, 2011; Yinnon and Elia, 2013). Currently, we are investigating quantitative implications.
reduce intermolecular collisions of randomly moving H2O neighboring on these domains. The reduction raises electric conductivity (Yinnon and Yinnon, 2011; Yinnon and Elia, 2013). Currently, we are investigating quantitative implications.
Rendering our qualitative SDVSASES model, detailed above, into a quantitative one requires numerous computations, which are beyond this paper’s scope.
Discussion
Correspondence Between SDVSASES Properties Predicted by QED, and Those Observed
Experimental data recently published, which evidence our SDVSASES model’s properties i–vii, we cite, analyze and discuss in paragraphs i-vii, respectively.
i. Domains in 0.5 M<C<2 M aqueous strong electrolytes were observed with laser light scattering, static light scattering and dynamic light scattering (DLS) (Li and Ogawa, 2000; Georgalis et al., 2000; Samal and Geckeler, 2001; Sedlak 2006). The domains’ properties agree with those of CDplasma (Yinnon and Yinnon, 2009, 2012). For example, the domain’s dissipative self-organizing and hysteresis properties point to EMFs’ mediating roles. Moreover, the observed value for ![]() in aqueous NaCl is 2×10⁻⁴ M. Ryzhkina et al. (2012) expanded DLS to concentrations below 1.83 M for aqueous NaCl SDVSASES and found:
in aqueous NaCl is 2×10⁻⁴ M. Ryzhkina et al. (2012) expanded DLS to concentrations below 1.83 M for aqueous NaCl SDVSASES and found:
(a) For 0.18 M<C<1.83 M, ~3×10⁻⁶ m sized domains and ~10-9 m sized hydrated solvated ion complexes are present.
(b) At physiological C=0.16 M, the domain size distribution differs from that one at C>0.16 M. Domains with diameters in the range of 1×10⁻⁷ – 5×10⁻⁷ m also form, with ~3×10⁻⁷ m sized domains dominating.
(c) For C=0.16 M, keeping samples in Permalloy containers does not significantly affect the ~3×10⁻⁶ m sized domains, but destroys those with diameters spanning 1×10⁻⁷ – 5×10⁻⁷ m. This is the earliest reported direct evidence, EMF mediate domains’ formation in aqueous solutions of strong electrolytes.
(d) For C<0.15 M, DLS cannot clearly distinguish the domains’ sizes.
Finding (a) confirms the presence of hydrated randomly moving ions and ~10-6 m sized CDplasma. Finding (b) corroborates, at certain concentrations, CDplasma stabilize 10-7 m ![]() forming ~3×10⁻⁷ m supra-
forming ~3×10⁻⁷ m supra-![]() . Additional corroboration is provided by 190-300 nm UV absorbance spectra. For ~10-4 M < C <~10-3 M SDVSASES, UV absorbance dependency on frequency is similar to that of Exclusion Zone Water and Iterative Nafionized Water — see Figure 1 in Lo (1996a), Figure 2 in Chai et al. (2008), Figure 1a in Elia et al. (2013), ascribed to UV EMF interacting with the quasi free electrons of
. Additional corroboration is provided by 190-300 nm UV absorbance spectra. For ~10-4 M < C <~10-3 M SDVSASES, UV absorbance dependency on frequency is similar to that of Exclusion Zone Water and Iterative Nafionized Water — see Figure 1 in Lo (1996a), Figure 2 in Chai et al. (2008), Figure 1a in Elia et al. (2013), ascribed to UV EMF interacting with the quasi free electrons of ![]() (Yinnon et al., 2015c). SDVSASES’ UV absorbance intensity depends on solute type and decreases with dilution (Lo, 1996a). As such it corresponds with the solute type and concentration dependency of the frequency of the plasma oscillations of the ions within CDplasma. It also corresponds with the diminishment in the fraction of ions incorporated in CDplasma, causing a reduction in the fraction of H2O incorporated in
(Yinnon et al., 2015c). SDVSASES’ UV absorbance intensity depends on solute type and decreases with dilution (Lo, 1996a). As such it corresponds with the solute type and concentration dependency of the frequency of the plasma oscillations of the ions within CDplasma. It also corresponds with the diminishment in the fraction of ions incorporated in CDplasma, causing a reduction in the fraction of H2O incorporated in ![]() . As to finding (c), with Permalloy mainly screening high frequency EMF, it indeed should destroy
. As to finding (c), with Permalloy mainly screening high frequency EMF, it indeed should destroy ![]() mediated by UV EMF but little affect CDplasma mediated by TetraHz – MegaHz EMF. Radio frequency screening is called for to expose TetraHz – MegaHz EMFs’ roles. Finding (d) hints supra-domains blur the various domain types’ diameters.
mediated by UV EMF but little affect CDplasma mediated by TetraHz – MegaHz EMF. Radio frequency screening is called for to expose TetraHz – MegaHz EMFs’ roles. Finding (d) hints supra-domains blur the various domain types’ diameters.
ii. At C≈![]() , the observed aqueous strong electrolytes’ measured molar conductivity dependence on concentration, i.e., Λ(C), sharp enhancement suggests superfluidity. For ~5×10⁻⁵ M<C<
, the observed aqueous strong electrolytes’ measured molar conductivity dependence on concentration, i.e., Λ(C), sharp enhancement suggests superfluidity. For ~5×10⁻⁵ M<C<![]() their measured molar conductivity dependence on macroscopic time, i.e., Λ(t), exhibits features typical of crystalline orderings and superfluidity (Lo and Li, 1999). These properties conform to those of solutions containing IPDplasma (Yinnon and Yinnon, 2012). Solute dependent UV absorbance intensity’s diminution with dilution for aqueous strong electrolytes with ~10-5 M < C <~10-4 M (Lo, 1996a), just as mentioned in the previous paragraph, suggests UV EMF interacting with the quasi free electrons of
their measured molar conductivity dependence on macroscopic time, i.e., Λ(t), exhibits features typical of crystalline orderings and superfluidity (Lo and Li, 1999). These properties conform to those of solutions containing IPDplasma (Yinnon and Yinnon, 2012). Solute dependent UV absorbance intensity’s diminution with dilution for aqueous strong electrolytes with ~10-5 M < C <~10-4 M (Lo, 1996a), just as mentioned in the previous paragraph, suggests UV EMF interacting with the quasi free electrons of ![]() . Only that in this paragraph mentioned concentration range,
. Only that in this paragraph mentioned concentration range, ![]() stabilization is facilitated by IPDplasma and UV absorbance’s dilution dependence is commensurate with diminishment of ions incorporated in IPDplasma, causing a reduction in the fraction of H2O incorporated in
stabilization is facilitated by IPDplasma and UV absorbance’s dilution dependence is commensurate with diminishment of ions incorporated in IPDplasma, causing a reduction in the fraction of H2O incorporated in ![]() .
.
iii. For C<~10-4 M≈![]() , fingerprints of ferroelectric orderings participating in dissipative dynamics in SDVSASES were first identified in their electric conductivity, dielectric permittivity, heat of mixing and pH data (Lo,1996a; Lo et al., 1996b; Elia and Niccoli, 2000). The fingerprints instigated studies of such orderings. Electrostatic models show thermal aggression prevents H2O ferroelectric ordering in SDVSASES at ambient conditions (Wong and Lo, 1998). QED analyses of the electric conductivity, heat of mixing and pH data indicate: vigorously agitating SDVSASES excites or ruptures IPDplasma, i.e., creates EDAIPDplasma; after agitations are over dissipative processes occur with EDAIPDplasma forming supra-EDAIPDplasma; additional agitations split EDAIPDplasma and supra-EDAIPDplasma(Yinnon and Yinnon, 2011; Yinnon and Elia, 2013). IR spectra pass band coefficient fluctuations (IR-SPBCF) of SDVSASES are consistent with these dissipative processes. For SDVSASES of HCl, NaCl, KCl, MgCl2 or CaCl2, IR-SPBCF are larger than those of control water; for SDVSASES of KCl, IR-SPBCF are larger than for SDVSASES of KBr, KI or K2SO4; also for SDVSASES of CaCl2, IR-SPBCF are larger than those for SDVSASES of CaBr2, CaI2 or CaSO4 — hinting the role of anions is larger than that of cations (Zubareva et al., 2003a, 2003b). IR-SPBCF are attributable to domain agglomeration (Fontana, 1994). Analyzing the relative impact of the various alkaline or earth alkaline cations and halide anions on domain formation, structure and dynamics in SDVSASES is beyond this paper’s scope.
, fingerprints of ferroelectric orderings participating in dissipative dynamics in SDVSASES were first identified in their electric conductivity, dielectric permittivity, heat of mixing and pH data (Lo,1996a; Lo et al., 1996b; Elia and Niccoli, 2000). The fingerprints instigated studies of such orderings. Electrostatic models show thermal aggression prevents H2O ferroelectric ordering in SDVSASES at ambient conditions (Wong and Lo, 1998). QED analyses of the electric conductivity, heat of mixing and pH data indicate: vigorously agitating SDVSASES excites or ruptures IPDplasma, i.e., creates EDAIPDplasma; after agitations are over dissipative processes occur with EDAIPDplasma forming supra-EDAIPDplasma; additional agitations split EDAIPDplasma and supra-EDAIPDplasma(Yinnon and Yinnon, 2011; Yinnon and Elia, 2013). IR spectra pass band coefficient fluctuations (IR-SPBCF) of SDVSASES are consistent with these dissipative processes. For SDVSASES of HCl, NaCl, KCl, MgCl2 or CaCl2, IR-SPBCF are larger than those of control water; for SDVSASES of KCl, IR-SPBCF are larger than for SDVSASES of KBr, KI or K2SO4; also for SDVSASES of CaCl2, IR-SPBCF are larger than those for SDVSASES of CaBr2, CaI2 or CaSO4 — hinting the role of anions is larger than that of cations (Zubareva et al., 2003a, 2003b). IR-SPBCF are attributable to domain agglomeration (Fontana, 1994). Analyzing the relative impact of the various alkaline or earth alkaline cations and halide anions on domain formation, structure and dynamics in SDVSASES is beyond this paper’s scope.
Light-, atomic force- and electron force-microscopy images of evaporated drops of NaCl SDVSASES with concentration of 1.7×10⁻⁷ M (Lo et al., 2009), also seem to confirm ferroelectric ordered H2O. The images resemble ice-frost patterns on windows exhibiting ~10-6-10-5 m elongated structures. Within each structure a feather-like pattern is observable, i.e., a line directed along the structure’s main axis intersecting at 102º with numerous parallel oriented stripes. With the angle between hydrogen and oxygen atoms in H2O for ice Ih and vapor, respectively, estimated at 109.47º and 104.5º, the observed 102º angle might be commensurate with H2O bending affected by their ferroelectric ordering. [Ferroelectric mobile water recently has been investigated with molecular dynamics simulations (Nakamura and Ohno, 2011) — their expansion for simulating EDAIPDplasma is called for.] Additional support for ferroelectric ordered H2O comes from the 1500 – 500 cm-1 IR spectrum of 10-7 M NaCl SDVSASES (Lo et al., 2009),f which differs from bulk water but is similar to that of Iterative Nafionized Water (Elia et al., 2013). The spectra evoke H2O librations in these liquids vary, with the variations attributable to ferroelectric ordered H2O (Yinnon et al. 2015c). IR spectra of ferroelectric-ordered H2O are scarce and mainly pertain to ice. Transitions from ice Ih to the ferroelectric-ordered ice XI are mainly reflected in librations (Arakawa et al., 2009)
iv. For ~10-13 M < C <~10-5 M , 190 – 300 nm UV absorbance intensity of SDVSASES as a function of concentration fluctuates, differs from that of bulk water, but only for ~10-7 M < C <~10-5 M fluctuations depend on solute type — see Figure 1a in Lo (1996a). These features are attributable to the quasi free electrons of ![]() interacting with UV EMF — in particular because the UV absorbance’s frequency dependency is similar to that of Exclusion Zone Water and Iterative Nafionized Water (Chai, 2008; Elia et al., 2013), ascribed to the quasi free electrons of
interacting with UV EMF — in particular because the UV absorbance’s frequency dependency is similar to that of Exclusion Zone Water and Iterative Nafionized Water (Chai, 2008; Elia et al., 2013), ascribed to the quasi free electrons of ![]() (Yinnon et al., 2015c).
(Yinnon et al., 2015c).
As to the solute dependent UV absorbance intensity, it evokes IPDplasma and EDAIPDplasma stabilize ![]() and supra-
and supra-![]() . Electron Force Microscopy images support this evocation. These reveal that the ~10-6 – 10-5 m elongated structures with their feather-like pattern, in paragraph iii conjectured to be EDAIPDplasma, have local charges on their surface generating -0.246 to 0.257 V electric potentials. These charges are attributable to the quasi free electrons of
. Electron Force Microscopy images support this evocation. These reveal that the ~10-6 – 10-5 m elongated structures with their feather-like pattern, in paragraph iii conjectured to be EDAIPDplasma, have local charges on their surface generating -0.246 to 0.257 V electric potentials. These charges are attributable to the quasi free electrons of ![]() .
.
Also electric conductivity phenomena are commensurate with EDAIPDplasma stabilizing ![]() , as will be discussed in paragraphs vii.c.2-4. (The solute independent fluctuations for ~10-13 M < C <~10-7 M , we discuss in paragraph vi.)
, as will be discussed in paragraphs vii.c.2-4. (The solute independent fluctuations for ~10-13 M < C <~10-7 M , we discuss in paragraph vi.)
v. Transmission electron and optical microscopy images indicate stabilization of CDrot. Transmission electron microscopy exposed ~10-5 m long and 10-7 – 10-6 m wide strips in ~10-11 M NaCl SDVSASES (see Lo 1996a, Figure 3a). Optical microscopy revealed rounded or oval molecular associates with ~10-4 m diameters in ~10-7 M NaCl SDVSASES (see Lo et al., 2009 Figure 4). The associates affect the liquids’ dielectric permittivity (Lo et al., 1996b). The strips conform to supra-CDrot with the CDrot organized in chain associates and their dipoles more or less parallel oriented. The rounded or oval associates conform to supra-CDrot with CDrot dipoles inverse-parallel oriented.
Electric conductivity, heat of mixing and pH data also indicate CDrot stabilization for concentrations below ~10-7 M (Elia and Niccoli, 1999, 2000, 2004a; Yinnon and Yinnon, 2011; Yinnon and Elia, 2013). The data reflect CDrot, and EDACDrot’s distinctive macroscopic time scale (months) dissipative dynamics underlying their agglomeration and reorganization in supra-domains. The data also expound that diluting without vigorous shaking the liquid reduces CDrot and EDACDrot numbers, with the reduction similar to the dilution ratio. The dissipative dynamics of CDrot and EDACDrot ostensibly also are reflected in IR-SPBCF. At a solute dependent concentration, much smaller than ![]() , e.g., C≈10-7 M for KCl SDVSASES and C≈10-8 M for CaCl2 SDVSASES, IR-SPBCF grow; at C≈10-10 M for KCl SDVSASES as well as for CaCl2 SDVSASES, IR-SPBCF have a maximum; a second maximum appears at C≈10-13 M for KCl SDVSASES and at C≈10-14 M for CaCl2 SDVSASES (Zubareva et al., 2003a). Hitherto, to the best of our knowledge, these IR-SPBCF enhancements are not explained in the context of QED. We ascribe these to EDAIPDplasma stabilizing the ~10-5 – 10-4 m CDrot and their organization in supra-CDrot, i.e., ≈10-7 M for KCl SDVSASES and ≈10-8 M for CaCl2 SDVSASES. As to the maxima at C≈10-10 M, C≈10-13 M and C≈10-14 M, also for IR-SPBCF of serial diluted vigorous shaken solutions of non-electrolytic compounds, maxima at similar concentrations were observed. As discussed by Yinnon and Liu (2015b), other variables of these non-electrolyte solutions (e.g., dielectric permittivity, electrokinetic potential, electric conductivity and domains’ diameter) too have extremums at these concentrations and seemingly are related to CDrot agglomeration, i.e., the orientations of the dipole moments of CDrotand EDACDrot within supra-CDrot.
, e.g., C≈10-7 M for KCl SDVSASES and C≈10-8 M for CaCl2 SDVSASES, IR-SPBCF grow; at C≈10-10 M for KCl SDVSASES as well as for CaCl2 SDVSASES, IR-SPBCF have a maximum; a second maximum appears at C≈10-13 M for KCl SDVSASES and at C≈10-14 M for CaCl2 SDVSASES (Zubareva et al., 2003a). Hitherto, to the best of our knowledge, these IR-SPBCF enhancements are not explained in the context of QED. We ascribe these to EDAIPDplasma stabilizing the ~10-5 – 10-4 m CDrot and their organization in supra-CDrot, i.e., ≈10-7 M for KCl SDVSASES and ≈10-8 M for CaCl2 SDVSASES. As to the maxima at C≈10-10 M, C≈10-13 M and C≈10-14 M, also for IR-SPBCF of serial diluted vigorous shaken solutions of non-electrolytic compounds, maxima at similar concentrations were observed. As discussed by Yinnon and Liu (2015b), other variables of these non-electrolyte solutions (e.g., dielectric permittivity, electrokinetic potential, electric conductivity and domains’ diameter) too have extremums at these concentrations and seemingly are related to CDrot agglomeration, i.e., the orientations of the dipole moments of CDrotand EDACDrot within supra-CDrot.
vi. Groupings of ~10-7 m domains, located within the 10-4 m long strips described in the previous paragraph, were depicted by transmission electron microscopy (see Figure 3 in Lo, 1996a). Their density within the strip increases on adding dielectric materials to SDVSASES. We identify the ~10-7 m domains as ![]() , their groupings as supra-
, their groupings as supra-![]() and the strip containing these as supra-CDrot <supra-
and the strip containing these as supra-CDrot <supra-![]() >, because:
>, because:
(a) 190-300 nm UV spectral features of SDVSASES for ~10-13 M < C <10-7 M (Lo, 1996a) are solute independent, differ from bulk water and are similar to those of Exclusion Zone Water and Iterative Nafionized Water (Chai, 2008; Elia et al., 2013). For Exclusion Zone Water and Iterative Nafionized Water, these features were ascribed to the quasi free electrons of ![]() interacting with UV EMF (Yinnon et al., 2015c).
interacting with UV EMF (Yinnon et al., 2015c).
(b) 2800 to 3800 cm-1 IR main H2O stretching band of ~10-7 M NaCl SDVSASES differ from bulk water, i.e., the former is red shifted by ~100 cm-1 (Lo et al., 2009).f Iterative Nafionized Water exhibits similar features (Elia et al., 2013), which are attributable to intramolecular interactions of H2O within ![]() (De Ninno and Congiu Castellano, 2011; De Ninno et al., 2013; Yinnon et al., 2015c).
(De Ninno and Congiu Castellano, 2011; De Ninno et al., 2013; Yinnon et al., 2015c).
(c) Electric conductivity phenomena agree with EDACDrot stabilizing ![]() — see below vii.c.5-6 and vii.d.
— see below vii.c.5-6 and vii.d.
(d) The electric dipole moments of CDrot and those of the clouds of the quasi free electrons interacting with the dielectric material contributes to supra-CDrot <supra-![]() > stabilization (Yinnon et al., 2015c).
> stabilization (Yinnon et al., 2015c).
(e) A domain diameter of ~10-7 m is similar to the diameter of ![]() .
.
Ho (2014) conjectured the ~10-7 m domains in ~10-11 M and in ~10-7 M NaCl SDVSASES observed by Lo et al. (1996a, 2009) are electrets comprised of ![]() . She reasoned that the spherical
. She reasoned that the spherical ![]() can mimic dipole interactions through the quasi free electrons on their periphery attracting positive charges just outside their borders. Consequently,
can mimic dipole interactions through the quasi free electrons on their periphery attracting positive charges just outside their borders. Consequently, ![]() s form a three-dimensional potentially perfectly symmetrical giant electret (dipole); there will be a dipole electric field in any direction; the electret’s 6-fold symmetry arises from close-packing of the spherical
s form a three-dimensional potentially perfectly symmetrical giant electret (dipole); there will be a dipole electric field in any direction; the electret’s 6-fold symmetry arises from close-packing of the spherical ![]() resulting in ‘snowflake’ like clusters. The combination of the coherent electronic oscillations of the H2O within
resulting in ‘snowflake’ like clusters. The combination of the coherent electronic oscillations of the H2O within ![]() (mediated by the EMFs condensed within their
(mediated by the EMFs condensed within their ![]() ), together with coherent rotational oscillations of these molecules, produces phase-locked coherent interactions among the
), together with coherent rotational oscillations of these molecules, produces phase-locked coherent interactions among the ![]() s (as identified by Del Giudice et al., 2010), resulting in stable supramolecular clusters with the electret structure.
s (as identified by Del Giudice et al., 2010), resulting in stable supramolecular clusters with the electret structure.
Moreover, Ho inferred that the initiating solute of the SDVSASES has the role of aligning the ![]() , while the sequential dilutions and vigorous shaking stimulates the coherent phase locking of the rotational oscillations among
, while the sequential dilutions and vigorous shaking stimulates the coherent phase locking of the rotational oscillations among ![]() s; as the solution becomes diluted, the vigorous shaking breaks up the clusters into small pieces, seeding more clusters that align with one another or coalesce into larger ones. This meta-stable state will spontaneously break symmetry to favor one direction over all others when drops are placed in contact with a solid substrate, thereby giving rise to a wide variety of aggregates or clusters.
s; as the solution becomes diluted, the vigorous shaking breaks up the clusters into small pieces, seeding more clusters that align with one another or coalesce into larger ones. This meta-stable state will spontaneously break symmetry to favor one direction over all others when drops are placed in contact with a solid substrate, thereby giving rise to a wide variety of aggregates or clusters.
Phase-locking between ![]() facilitated by coherent rotational oscillations of their molecules [cited in the last paragraph] underlies the [supra-CDrot <supra-
facilitated by coherent rotational oscillations of their molecules [cited in the last paragraph] underlies the [supra-CDrot <supra-![]() >] formation mechanism (detailed in our SDVSASES model’s paragraph vi). However, to the best of our knowledge, the interactions between the initiating solutes and
>] formation mechanism (detailed in our SDVSASES model’s paragraph vi). However, to the best of our knowledge, the interactions between the initiating solutes and ![]() resulting in alignment of the latter, as well as the need for sequential dilution with succussions for stimulating the phase-locking, were not elucidated in Ho’s (2014) or other publications. We regard IPDplasma’s formation below
resulting in alignment of the latter, as well as the need for sequential dilution with succussions for stimulating the phase-locking, were not elucidated in Ho’s (2014) or other publications. We regard IPDplasma’s formation below ![]() , their vigorous shaking induced excitation or break up leading to EDAIPDplasma creation, CDrot’s stabilization by EDAIPDplasma for concentrations below , and EDACDrot creation by vigorous shaking to be the central aspects of our model required for explaining SDVSASES’s properties, as detailed by Yinnon and Yinnon (2011) and Yinnon and Elia (2013).As to stabilization of
, their vigorous shaking induced excitation or break up leading to EDAIPDplasma creation, CDrot’s stabilization by EDAIPDplasma for concentrations below , and EDACDrot creation by vigorous shaking to be the central aspects of our model required for explaining SDVSASES’s properties, as detailed by Yinnon and Yinnon (2011) and Yinnon and Elia (2013).As to stabilization of ![]() and their agglomeration in supra-
and their agglomeration in supra-![]() , triggered by their interactions with CDrot, EDAIPDplasma, EDACDrot, CDplasma or IPDplasma, according to our model it affects some SDVSASES physicochemical properties.
, triggered by their interactions with CDrot, EDAIPDplasma, EDACDrot, CDplasma or IPDplasma, according to our model it affects some SDVSASES physicochemical properties.
Paragraphs’ iii and v cited data, indicating ferroelectric ordering of H2O, do not unambiguously differentiate between EDAIPDplasma, CDrotand EDACDrot. Only IR-SPBCF point to a ![]() . Also differences in the diameters of the various domains signify dissimilar ordering types. Disparities between ferroelectric orderings present at ~10-18 M<C<~10-6 M ranges, however, were exposed for serial diluted vigorous shaken solutions of weak- or non-electrolytic compounds by measuring their dielectric permittivity, as we discuss in Yinnon and Liu (2015b). Thus analogous dielectric permittivity measurements for SDVSASES are called for. While awaiting their results, we note that electric conductivity data conform with the central aspects of our model (Yinnon and Yinnon, 2011; Yinnon and Elia, 2013), in particular the electric conductivity analyses we present below in vii.(c).
. Also differences in the diameters of the various domains signify dissimilar ordering types. Disparities between ferroelectric orderings present at ~10-18 M<C<~10-6 M ranges, however, were exposed for serial diluted vigorous shaken solutions of weak- or non-electrolytic compounds by measuring their dielectric permittivity, as we discuss in Yinnon and Liu (2015b). Thus analogous dielectric permittivity measurements for SDVSASES are called for. While awaiting their results, we note that electric conductivity data conform with the central aspects of our model (Yinnon and Yinnon, 2011; Yinnon and Elia, 2013), in particular the electric conductivity analyses we present below in vii.(c).
vii. Various electric conductivity measures for SDVSASES were reported:
(a) For ~2.5×10⁻² M < C <~3.5×10⁻¹ M aqueous NaCl, KCl, NaOH or HCl, Lo and Li (1999) measured the molar conductivity as a function of C1/2, i.e., Λ(C1/2). They did not specify their dilution procedure. They found that for the aforementioned narrow concentration range, Λ(C1/2)’s linear dependence on C1/2 agrees with that predicted by the customary electrostatic models. In these models (Robinson and Stokes, 2002), it is assumed that at all concentrations: all ions are in a “gas-like” state, move independently, share in the liquid’s Brownian motion; on applying an alternating voltage to electrodes placed in the liquid, the resulting alternating current electric fields experienced by the ions bias their movement; ion-ion, ion-H2O and H2O – H2O collisions dampen the ions’ movements induced by the alternating current electric field. The electrostatic models were mainly developed during 1930 – 1950. To attain quantitative agreement between predicted and measured Λ(C1/2), empirical constants inclusion in Λ(C1/2) equations proved necessary. The constants were supposed to reflect the electrophoretic and relaxation effects. Even their inclusion only enabled fitting theoretical to experimental data for narrow concentration ranges, e.g., ranges of about 0.1 M for C < ~0.1 M, as is the case for Lo and Li’s aforementioned findings. Consequently hitherto according to electrostatic theories, Λ(C1/2) are puzzling phenomena (Robinson and Stokes, 2002). Domains with their concentration dependent prevalence, observed during the last 15 years, in tandem with QED promise a solution for these puzzles. In particularly, because QED indicates: plasma oscillations of all ions within a CDplasma or a supra-CDplasma are coherent and resonate with EMF condensed within the domain, preventing these ions and their hydration H2O to collide (a single collision would destroy the coherence); the fraction of ions incorporated in CDplasma depends on concentration; CDplasma stabilizing ![]() and supra-
and supra-![]() depends on concentration, hence the fraction of H2O included in
depends on concentration, hence the fraction of H2O included in ![]() depends on concentration; the H2O included in
depends on concentration; the H2O included in ![]() and surpra-
and surpra-![]() also oscillate coherently and do not collide.
also oscillate coherently and do not collide.
The aforesaid implies that the electrostatic models’ assumptions only partly hold, and their empirical constants most likely also reflect domain presence. Currently, we attempt to develop a QED Λ(C1/2) model. For C>![]() , it foremost requires deriving: the fraction of ions included in CDplasma and its dependence on concentration; the fraction of H2O included in
, it foremost requires deriving: the fraction of ions included in CDplasma and its dependence on concentration; the fraction of H2O included in ![]() and its dependence on concentration; interactions between an electric field induced by alternating currents, the ions incorporated in CDplasma, and the quasi free electrons of
and its dependence on concentration; interactions between an electric field induced by alternating currents, the ions incorporated in CDplasma, and the quasi free electrons of ![]() ; average supra-CDplasma and supra-
; average supra-CDplasma and supra-![]() diameters. Its future verification warrants accurate data on domain prevalence and the diameter of the domains for a wide concentration range. Currently such data are not available. Appropriate measurements are called for. In particular under ambient and hypo-electromagnetic conditions, i.e., in containers screening high frequency or radio frequency radiation. These are capable of elucidating, respectively, the fraction of H2O included in
diameters. Its future verification warrants accurate data on domain prevalence and the diameter of the domains for a wide concentration range. Currently such data are not available. Appropriate measurements are called for. In particular under ambient and hypo-electromagnetic conditions, i.e., in containers screening high frequency or radio frequency radiation. These are capable of elucidating, respectively, the fraction of H2O included in ![]() and its dependence on concentration, the fraction of ions incorporated in CDplasma and its dependence on concentration.
and its dependence on concentration, the fraction of ions incorporated in CDplasma and its dependence on concentration.
(b) For ~5×10⁻⁵ M < C <~5×10⁻⁴ M aqueous NaCl, KCl, NaOH or HCl, Lo and Li (1999) measured Λ(C1/2) and the time dependence of molar conductivity Λ(t). They did not specify their dilution procedure.
They found:
1. Λ(C1/2) has an inflection point at C =1.7×10⁻⁴ M [see Figures 1 and 2 in Lo and Li (1999)]. For 1.7×10⁻⁴ M < C <5×10⁻⁴ M, Λ(C1/2) is a gentle negatively sloped curve. For 3.0×10⁻⁵ M < C <1.7×10⁻⁴ M, Λ(C1/2) is linear with a huge negative slope, indicating a phase transition.
2. Λ(t) oscillates for 3×10⁻⁵ M < C <2×10⁻⁴ M. Fourier transforms of Λ(t) reveal spectra with sharp resonances. Two dominant peaks at 0.38 and 0.48 Hz, with strongly concentration dependent intensities (maximal at C =1.7×10⁻⁴ M), are observable in Figures 3 and 5 in Lo and Li (1999). These features point to crystalline structured domains present in a narrow concentration range — as discussed in Yinnon and Yinnon (2012).
3. Amplitudes of Λ(t) oscillations (A) are C dependent, and maximal at C =1.7×10⁻⁴ M. Decomposing Λ into two parts, Λ =+A with representing average Λ, reveals the ratio ’s dependence on concentration, i.e., (C). It has a sharp peak at C =1.7×10⁻⁴ M, a steeply negative sloped curve for 1.7×10⁻⁴ M < C <2.0×10⁻⁴ M, a gentle positively sloped curve for 3.0×10⁻⁵ M < C <1.7×10⁻⁴ M [see Figure 4 in Lo and Li (1999)]. As such (C) resembles the temperature-dependent transition from normal helium I liquid to superfluid helium II, pointing to superfluidic structures.
QED analyses show features (1) – (3) fully agree with CDplasma to IPDplasma transitions (Yinnon and Yinnon, 2012). These reflect: IPDplasma superfluidic crystalline nature; the fraction of ions incorporated in IPDplasma dependence on concentration, i.e., the fraction diminishes on dilution due to reduction in IPDplasma numbers — see SDVSASES’s model’s paragraph ii. As such, measuring Λ(C1/2), Λ(t) and (C) enables unambiguous identification of IPDplasma and the fraction of ions incorporated in IPDplasma dependence on concentration, while analyses of Fourier transforms of Λ(t) enable delineating their crystalline features. Effects of vigorous shaking on Λ(t) Fourier spectra have not yet been analyzed. We expect EDAIPDplasma, created by vigorous shaking induced excitations or break up of IPDplasma, to affect the spectra. Research is called for to investigate experimentally such effects and to develop Fourier transform analyses of Λ(t) as a tool for analyzing EDAIPDplasma creation, their characteristics and their agglomeration into supra-EDAIPDplasma.
(c) For ~2×10-15 M < C <~1×10⁻⁴ M NaCl SDVSASES, Ryzhkina et al. (2012) measured the electric conductivity for samples kept at laboratory bench (χlb) or in Permalloy containers (χp) and found:
1. For ~3×10⁻⁵ M < C <~1×10⁻⁴ M, χlb steeply increases with concentration, i.e., from ~6 μS/cm at C≈3×10⁻⁵ M to 25 μS/cm at C≈1×10⁻⁴ M. This finding corresponds with that cited above in paragraph vii.(b).1. It confirms our QED SDVSASES model’s prediction ii.
2. For ~3×10⁻⁵ M < C <~1×10⁻⁴ M, χlb and χp do not significantly differ. This finding agrees with our QED SDVSASES model’s prediction that IPDplasma, and EDAIPDplasma formation is mediated by TetraHz – MegaHz EMF, which are not effectively screened by Permalloy. Hence keeping samples in Permalloy containers should not significantly affect these domains, but it might affect ![]() stabilized by IPDplasma or EDAIPDplasma — respectively, see ii and iv above. Screening samples from radio frequency radiation is called for to expound electrodynamic interactions underlying IPDplasma andEDAIPDplasma formation. Difference in the dependence of electric conductivity on concentration observed for SDVSASES samples screened by Permalloy or radio frequency-screening materials promises elucidating relative prevalence of IPDplasma and EDAIPDplasma versus prevalence of
stabilized by IPDplasma or EDAIPDplasma — respectively, see ii and iv above. Screening samples from radio frequency radiation is called for to expound electrodynamic interactions underlying IPDplasma andEDAIPDplasma formation. Difference in the dependence of electric conductivity on concentration observed for SDVSASES samples screened by Permalloy or radio frequency-screening materials promises elucidating relative prevalence of IPDplasma and EDAIPDplasma versus prevalence of ![]() .
.
3. For ~2×10⁻⁶ M < C <~3×10⁻⁵ M, both χlb and χp are about constant, i.e., respectively, χlb=6 μS/cm and χp=2.5 μS/cm. (Doubly distilled water used for preparing and diluting SDVSASES had an electric conductivity below 1.5 μS/cm.) The difference between χlb and χp indicates domains mediated by high frequency EMF are present. In correspondence with our SDVSASES model’s prediction iv and its evidence presented in paragraph iv, the difference is attributable to ![]() and supra-
and supra-![]() stabilized by IPDplasma and EDAIPDplasma.
stabilized by IPDplasma and EDAIPDplasma.
4. For ~2×10⁻⁸ M < C <~2×10⁻⁶ M, on diluting from C≈2×10⁻⁶ M to C≈2×10⁻⁸ M both χlb and χp more or less linearly approach ~2.5 μS/cm. Most likely, this indicates that dilution-induced reduction in IPDplasma and EDAIPDplasma numbers diminishes ![]() prevalence.
prevalence.
5. For ~1×10-13 M < C <~2×10⁻⁸ M , on diluting from C≈2×10⁻⁸ M, χlb linearly increases from ~2.5 μS/cm till it reaches a maximum of ~7 μS/cm at C≈10-10 M. Additional dilutions to C≈10-13 M diminish χlb more or less linearly to 2 μS/cm. IR-SPBCF of SDVSASES too exhibit a maximum at C≈10-10 M (see paragraph v). IR-SPBCF and features in SDVSASES UV and 2800 to 3800 cm-1 IR spectra for C<10-7 M, we attributed to EDAIPDplasma stabilizing the ~10-5 – 10-4 m CDrot and their agglomeration into supra-CDrot (see paragraph v), with these subsequently stabilizing ![]() and supra
and supra![]() – resulting in supra-CDrot <supra-
– resulting in supra-CDrot <supra-![]() > formation (see paragraph vi). χp measurements provide additional verification for this attribution.
> formation (see paragraph vi). χp measurements provide additional verification for this attribution.
On diluting from C≈2×10⁻⁸ M to C≈2×10-15 M , χp smoothly diminishes from ~2.5 μS/cm to 2 μS/cm. The significant differences between χlb and χp are ascribable to the absence of domains in the samples screened by Permalloy. Thus the threshold concentration (Cthr), below which no domains are present in samples screened by Permalloy, is ~2×10⁻⁸ M. This absence of domains indeed is consistent with IR and UV EMF, respectively, mediating CDrot and formation ![]() . Our attribution that χlb’s distinctive changes at C≈2×10⁻⁸ M result from CDrot stabilization implies for aqueous NaCl that ≈Cthr≈2×10⁻⁸ M. The differences between χlb and χp for C<2×10⁻⁸ M — a concentration range at which IPDplasma and EDAIPDplasma prevalence is very low — connotes screening by Permalloy facilitates distinguishing between ferroelectric ordering of H2O in CDrot and its broken pieces (EDACDrot) versus that one in EDAIPDplasma or IPDplasma. Our attribution EDAIPDplasma stabilizes CDrot at C≈2×10⁻⁸ M also means that only when vigorous shaking transforms IPDplasma into EDAIPDplasma CDrot can form, i.e., the observed absence of supramolecular orderings for C<Ccrit in serial diluted solutions which at each dilution step are not vigorously shaken (Elia and Niccoli, 1999, 2000, 2004a) means Ccrit=
. Our attribution that χlb’s distinctive changes at C≈2×10⁻⁸ M result from CDrot stabilization implies for aqueous NaCl that ≈Cthr≈2×10⁻⁸ M. The differences between χlb and χp for C<2×10⁻⁸ M — a concentration range at which IPDplasma and EDAIPDplasma prevalence is very low — connotes screening by Permalloy facilitates distinguishing between ferroelectric ordering of H2O in CDrot and its broken pieces (EDACDrot) versus that one in EDAIPDplasma or IPDplasma. Our attribution EDAIPDplasma stabilizes CDrot at C≈2×10⁻⁸ M also means that only when vigorous shaking transforms IPDplasma into EDAIPDplasma CDrot can form, i.e., the observed absence of supramolecular orderings for C<Ccrit in serial diluted solutions which at each dilution step are not vigorously shaken (Elia and Niccoli, 1999, 2000, 2004a) means Ccrit=![]() .
.
6. On diluting from C≈2×10-13 M to C≈2×10-15 M , χlb more or less linearly increases from 2 μS/cm to 2.5 μS/cm while χp stays constant at 2 μS/cm. These data indicate presence of few CDrot, ![]() and supra-CDrot <supra-
and supra-CDrot <supra-![]() >. As such these support our earlier conclusions based on IR-SPBCF (see paragraphs v-vi).
>. As such these support our earlier conclusions based on IR-SPBCF (see paragraphs v-vi).
(d) For 10-24 M < C <~10-9 M as well as for solutions diluted beyond ~10-24 M, for aqueous SDVSASES of NaCl or MgCl, Elia et al. (2008) and Belon et al. (2008) measured ![]() ≠0. Here
≠0. Here ![]() represent the difference between χlb of SDVSASES and χlb of serial diluted solutions with chemical composition equivalent to that of SDVSASES but prepared without vigorous shaking at each dilution step.
represent the difference between χlb of SDVSASES and χlb of serial diluted solutions with chemical composition equivalent to that of SDVSASES but prepared without vigorous shaking at each dilution step. ![]() zigzag-like varies with concentration.
zigzag-like varies with concentration. ![]() increases with the sample’s age, with the increment being an inverse function of the sample’s volume. QED analyses by Yinnon and Elia (2013) show: the aging effect is attributable to CDrot agglomeration dynamics; the volume effect is attributable to interfaces contributing to CDrot stabilization — samples with smaller volume have larger surface/volume ratio, leading to enhanced CDrot stabilization.
increases with the sample’s age, with the increment being an inverse function of the sample’s volume. QED analyses by Yinnon and Elia (2013) show: the aging effect is attributable to CDrot agglomeration dynamics; the volume effect is attributable to interfaces contributing to CDrot stabilization — samples with smaller volume have larger surface/volume ratio, leading to enhanced CDrot stabilization.
(e) The findings and related conclusions, presented in aforementioned paragraphs (c 1-6) and (d), imply modeling the electric conductivity dependence on concentration for C<~3×10⁻⁵ M SDVSASES requires adequate description of the alternating current electric field interactions with the dipole moments of EDAIPDplasma, of CDrot, of EDACDrot and of the quasi free electrons clouds of ![]() . Since domains with electric dipoles may align parallel or anti-parallel, seemingly spin models are required for generating adequate distributions of supra-EDAIPDplasma, supra-EDACDrot and supra-CDrot.
. Since domains with electric dipoles may align parallel or anti-parallel, seemingly spin models are required for generating adequate distributions of supra-EDAIPDplasma, supra-EDACDrot and supra-CDrot.
The experimental data cited in the above paragraphs i-vii and their analyses support our SDVSASES model’s aspects i-vii, respectively.
Conclusions
Domain formation in SDVSASES, mediated by EMF, is expounded in this paper. These liquids’ QED model (proposed in 2011) in the past facilitated explicating their measured physicochemical properties. In this paper we show it also enables consistently explaining their recently observed properties for concentrations down to ~10-20 M.
Our main findings are:
A. H2O interacting with EMF underlying the 10-5 – 10-4 m sized domains in SDVSASES at concentrations below ![]() , which is a basic tenet of the model, for the first time is unambiguously confirmed by this study’s analyses of experiments by Konovalov’s group [see Ryzhkina et al. (2012); Konovalov and Ryzhkina (2014)]. Conditions for H2O ferroelectric auto-ordering in 10-5 – 10-4 m sized domains mediated by EMF were predicted by Del Giudice et al. (1988) and Del Giudice and Vitiello (2006) with QED. These domains, denoted CDrot in previous publications, are quantum manifestations of a classical physics liquid-liquid phase transition in polar liquids (Sivasubramanian et al., 2005). Experimental evidence for this phase transition was recently obtained for water perturbed by Nafion membranes (Yinnon et al., 2015c). As to QED’s predictions concerning CDrot’s size, EMF mediated auto-organization, ferroelectric ordering of its H2O and
, which is a basic tenet of the model, for the first time is unambiguously confirmed by this study’s analyses of experiments by Konovalov’s group [see Ryzhkina et al. (2012); Konovalov and Ryzhkina (2014)]. Conditions for H2O ferroelectric auto-ordering in 10-5 – 10-4 m sized domains mediated by EMF were predicted by Del Giudice et al. (1988) and Del Giudice and Vitiello (2006) with QED. These domains, denoted CDrot in previous publications, are quantum manifestations of a classical physics liquid-liquid phase transition in polar liquids (Sivasubramanian et al., 2005). Experimental evidence for this phase transition was recently obtained for water perturbed by Nafion membranes (Yinnon et al., 2015c). As to QED’s predictions concerning CDrot’s size, EMF mediated auto-organization, ferroelectric ordering of its H2O and ![]() , these are for the first time verified by this paper’s analyses of ~10-20 M<C<~10-1 M SDVSASES. The analyses also indicate ~10-10 M<
, these are for the first time verified by this paper’s analyses of ~10-20 M<C<~10-1 M SDVSASES. The analyses also indicate ~10-10 M<![]() <~10-6 M depends on solute type — hitherto
<~10-6 M depends on solute type — hitherto ![]() values have not been ab initio derived.
values have not been ab initio derived.
B. H2O interactions with EMF resulting in about 10-7 m sized domains [predicted by Preparata, (1995 chapter 10) and Arani et al. (1995) with QED] is for the first time verified by our analyses of SDVSASES properties measured by Ryzhkina et al. (2012) and Konovalov and Ryzhkina (2014). Previous studies provided indirect evidence for these domains, which were denoted ![]() (Yinnon and Yinnon, 2009; Del Giudice et al., 2010, 2013, Montagnier et al., 2011). Analyses of water perturbed by Nafion verified characteristics of the phase transition underlying their formation (Yinnon et al., 2015c). Our analyses verify ’s
(Yinnon and Yinnon, 2009; Del Giudice et al., 2010, 2013, Montagnier et al., 2011). Analyses of water perturbed by Nafion verified characteristics of the phase transition underlying their formation (Yinnon et al., 2015c). Our analyses verify ’s ![]() predicted size,
predicted size, ![]() quasi free electrons, EMF mediated auto-organization of
quasi free electrons, EMF mediated auto-organization of ![]() and their stabilization by CDrot for concentrations below
and their stabilization by CDrot for concentrations below ![]() and by other domain types for concentrations above
and by other domain types for concentrations above ![]() .
.
C. Our analyses corroborate and complement conclusions drawn in our previous QED studies of SDVSASES. In particular, their domains not forming under hypo-electromagnetic conditions [as de-monstrated by Ryzhkina et al. (2012) and Konovalov and Ryzhkina (2014)] signify electrodynamic interactions may play significant roles in water and its solutions. Thus, our study underlines: the customary assumptions that only electrostatic interactions between molecules in aqueous systems have to be described explicitly and electrodynamic interactions can be treated perturbatively do not suffice for accounting for all phenomena.
As to implications of our SDVSASES analyses, these expound characteristic of aqueous systems, knowledge of which is of vast importance for basic research and technology. As to basic research, we suffice with mentioning that it is well known that the customary electrostatic theories hitherto cannot explain numerous properties of aqueous systems. The noticeable role of electrodynamic interactions in SDVSASES renders it a good test case for studying their effects. For example, their effects on electron transfer between bio-molecules, as we discuss in the following paper in this journal’s issue (Yinnon and Liu, 2015b). As to technological relevance, serial dilutions and vigorous shaking affecting ferroelectric ordering in water have implications for ferroelectric materials’ production and liquid films’ technology, e.g., water film mixers (Liu et al., 2013).
The abovementioned stresses that future research of SDVSASES is desirable. In addition to the various research projects mentioned in the previous section, we foremost propose:
(a) Isolating domains from SDVSASES and studying these with the techniques employed for Iterative Nafionized Water’s domains (Elia et al., 2013; Yinnon et al. 2015c), and delineating these domains characteristics’ dependence on the concentration of SDVSASES for ~10-20 M<C<~10-3 M.
(b) Studying the effects of EMFs on isolated SDVSASES domains.
(c) Identifying solute characteristics determining the critical concentration below which CDrot can form.
(d) Quantitative analyses and computer simulations complementing our qualitative study.
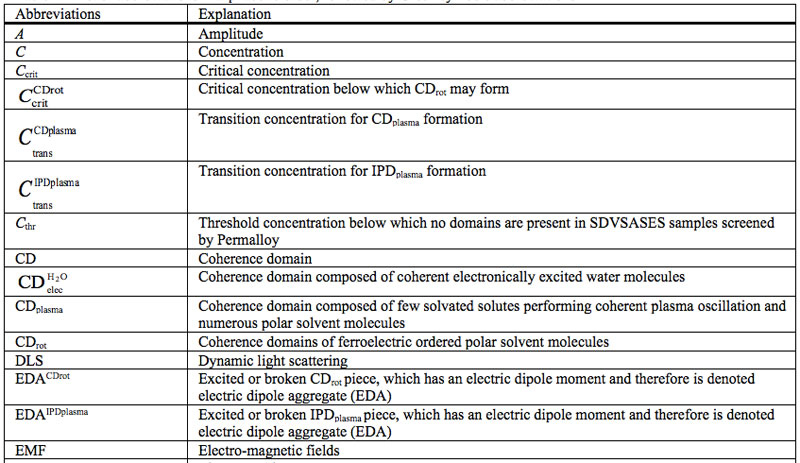
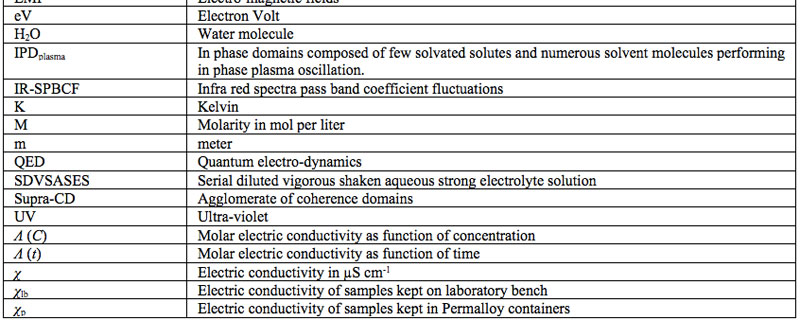
Table 1: List of abbreviations in alphabetic order, followed by Greek symbols abbreviations.
Acknowledgements
With much appreciation we thank Prof. A. I. Konovalov for his many helpful discussions, his careful reading of the manuscript and his detailed constructive comments. Tamar Yinnon expresses her gratitude to Prof. A. M. Yinnon for his continuous support and encouragement. She also thankfully acknowledges the valuable discussions with Prof. N.P. Pal’mina and her technical support. Z.-Q. Liu thankfully acknowledges the support of the National Natural Science Foundation of China (No. 11302118), Natural Science foundation of Shandong Province (No. ZR2013AQ015) and the Science Foundation of Qufu Normal University (No. BSQD2012053, xkj201305).
References
Arani R, Bono I, Del Giudice E; Preparata G (1995). QED coherence and the thermodynamics of water. Int J Mod Phys B 9: 1813-1841.
Arakawa M, Kagi H, Fukazawa H (2009). Laboratory measurements of infrared absorption spectra of hydrogen-ordered ice: a step to the exploration of ice XI in space. Astrophys J Suppl Series 184: 361-370.
Belon P, Elia V, Elia L, Montanino M, Napoli E, Niccoli M (2008). Conductometric and calorimetric studies of the serial diluted and agitated solutions — On the combined anomalous effect of time and volume parameters. J Therm Anal Cal 93: 459 -469.
Chai BH, Zheng JM, Zhao Q, Pollack GH (2008). Spectroscopic Studies of Solutes in Aqueous Solution. J Phys Chem A 112: 2242-2247.
De Ninno A, Congiu Castellano A (2011). Co-ordination of water molecules in isotopic mixtures. J Mol Struct 1006: 434-440.
De Ninno A, Congiu Castellano A, Del Giudice E (2013). The supramolecular structure of liquid water and quantum coherent processes in biology. J Phys: Conf Ser 442: 012031 p.1 to 9.
Del Giudice E, Prepara G, Vitiello G (1988). Water as a free electric dipole laser. Phys Rev Lett 61: 1085-1088.
Del Giudice E, Preparata G (1998). “A new QED picture of water”, in Macroscopic Quantum Coherence, eds. Sassaroli E, Srivastava YN, Swain J, Widom A. (World Scientific, Singapore).
Del Giudice E, Preparata G, Fleischmann M ( 2000). QED coherence and electrolyte solutions. J Electroanal Chem 482: 110–116.
Del Giudice E, Vitiello G. (2006). Role of the electromagnetic field in the formation of domains in the process of symmetry-breaking phase transitions. Phys Rev A 74: 022105-1-022105-9.
Del Giudice E, Spinetti PR and Tedeschi A (2010). Water dynamics at the root of metamorphosis in living organisms. Water 2: 566-586.
Del Giudice E, Tedeschi A, Vitiello G, Voeikov VL (2013). Coherent structures in liquid water close to hydrophilic surfaces. J Phys: Conf Ser 442: 012028.
Elia V, Niccoli M (1999). Thermodynamics of Extremely Diluted Aqueous solutions. Ann New York Acad Sci 870: 241-248.
Elia V, Niccoli M (2000). New Physico-chemical properties of water induced by mechanical treatments: A calorimetric study at 25ºC. J Therm Anal Cal 61: 527-537.
Elia V, Niccoli M (2004a). New Physico-chemical properties of extremely diluted aqueous solutions. J Therm Anal Cal 75: 815-836.
Elia V, Napoli E, Niccoli M, Nonatelli L, Ramaglia A, Ventimiglia E (2004b). New Physico-chemical properties of extremely diluted aqueous solutions. J Therm Anal Cal 78: 331–342.
Elia V, Napoli E, Niccoli M, Marchettini N, Tiezzi E (2008). New physic-chemical properties of extremely dilute solutions. A conductivity study at 25ºC in relation to aging. J Solution Chem 37: 85-96.
Elia V, Napoli E (2010). Dissipative structures in extremely diluted solutions of homeopathic medicines. A molecular model based on physico-chemical and gravimetric evidences. Int J Des Nat 5: 39-48.
Elia V, Ausanio G, De Ninno A, Gentile F, Germano R, Napoli E, Niccoli M (2013). Experimental evidence of stable aggregates of water at room temperature and normal pressure after iterative contact with a Nafion® polymer membrane. WATER Journal 5: 16-26.
Elia V, Germano R, Napoli E, (2015). Permanent Dissipative Structures in Water: The Matrix of Life? Experimental Evidences and their Quantum Origin. Curr Top Med Chem 15: 559-571.
Fontana MP (1994). Raman and IR fluctuation spectroscopy of liquid crystals, in: The molecular dynamics of liquid crystals. Luckhurst GR and Veracini CA, Kluwer Acad Pub, The Netherlands. p.403-430.
Georgalis G, Kierzek AM, Saenger W (2000). Cluster Formation in Aqueous Electrolyte Solutions Observed by Dynamic Light Scattering. J Phys Chem B 104: 3405-3406.
Ho M-W (2014). Large Supramolecular Water Clusters Caught on Camera – A Review. WATER Journal 6: 1-12.
Horne RA (1971). Water and Aqueous Solutions: Structure, Thermodynamic and Transport Processes. Wiley-Interscience New York. Chapters 8-12.
Konovalov AI, Ryzhkina IS (2014). Reviews: Formation of nanoassociates as a key to understanding of physicochemical and biological properties of highly dilute aqueous solutions. Russ Chem Bull Int Ed 63: 1-14.
Kožíšek F, Auerbach D, Gast MKH, Lindner K (2013). Comment on: “Evidence for the existence of stable-water-clusters at room temperature and normal pressure” [ Phys. Lett. A 373 (2009) 3872] in Phys Lett A 377: 2826–2827.
Li L, Ogawa T (2000). Clusters and their properties in aqueous solutions of KDP, KCl and sugar. J Cryst Growth 211: 286-289.
Liu ZQ, Li YL, Gan KY, Jiang SR, Zhang GC (2013). Water film washers and mixers: their rotational modes and electrohydrodynamical flows induced by square-wave electric fields. Microfluid Nanofluid 14: 319-328.
Lo S-Y (1996a). Anomalous state of ice. Mod Phys Lett 10: 909-919.
Lo S-Y, Lo A, Chong LW, Tianzhang L, Hua LH, Geng XU (1996b). Physical properties of water with IE structures. Mod Phys Lett 10: 921-930.
Lo S-Y, Li W (1999). Onsagers’s formula, conductivity and possible new phase transition. Mod Phys Lett B 13: 885-893.
Lo S-Y, Geng XU, Gann, D (2009). Evidence of stable-water-clusters at room temperature and normal pressure. Phys Lett A 373: 3872 -3876.
Lo S-Y (2013). Reply to the Comment by F. Kožíšek et al. On “Evidence for the existence of stable-water-clusters at room temperature and normal pressure”[Phys.Lett.A373(2009)3872] in Phys Lett A 377: 2828–2829.
Montagnier L, Aissa J, Del Giudice E, Lavallee C, Tedeschi A, Vitiello G (2011). DNA waves and water. J Phys: Conf Ser 306: 012007.
Nakamura Y, Ohno T (2011). Ferroelectric mobile water. Phys Chem Chem Phys 13: 1064–1069.
Preparata G (1995). QED Coherence in Matter. World Scientific, Singapore, New Jersey, London, Hong Kong.
Raine SR, So HB (1993). An energy based parameter for the assessment of aggregate bond energy. J Soil Science 44:249-259.
Robinson RA, Stokes RH (2002). Electrolyte Solutions. Dover Publications Inc., Mineola, New York. Chapters 1-3.
Ryzhkina IS, Murtazina LI, Masagutova EM, Mishina OA, Pavlova TP, Fridland SV, Academician Konovalov AI (2012). Self-Organization of Sodium Chloride Solutions in the Absence and Presence of a Biologically Active Substance of Low Concentration under Common and Hypoelectromagnetic Conditions. Dokl Phys Chem 446:184-189.
Samal S, Geckeler KE (2001). Unexpected solute aggregation in water on dilution. Chem Commun 2224–2225.
Sedlak M (2006) Large-scale supramolecular structure in solutions of low molar mass compounds and mixtures of liquids. J Phys Chem B 110: 4329-4338; 4339-4345; 13976-13984.
Sedlak M, Rak D (2013) Large-scale inhomogeneities in solutions of low molar mass compounds and mixtures of liquids: Supramolecular structures or nanobubbles? J Phys Chem B 117: 2495-2504.
Sivasubramanian S, Widom A, Srivastava YN (2005). The Clausius–Mossotti phase transition inpolar liquids. Physica A 345: 356 -366.
Wong C, Lo S-Y (1998). Possible mechanism of formation and stability of anomalous state of water, in: Lo S-Y, Bonavida B (Eds.), Proceedings of the 1st International Symposium on Physical, Chemical and Biological Properties of Stable Water Clusters. World Scientific, p. 48-63.
Yinnon CA, Yinnon TA (2009). Domains in aqueous solutions: theory and experimental evidence. Mod Phys Lett 23: 1959-1973.
Yinnon TA, Yinnon CA (2011). Electric dipole aggregates in very dilute polar liquids: Theory and experimental evidence. Int J Mod Phys B 25: 3707-3743.
Yinnon TA, Yinnon CA (2012). Domains of solvated ions in aqueous solutions, their characteristics and impact on electric conductivity: theory and experimental evidence. Mod Phys Lett B 26: 1150006, 1-14.
Yinnon TA, Elia V (2013). Dynamics in perturbed very dilute aqueous solutions: theory and experimental evidence. Int J Mod Phys B 27: 1350005, 1-35.
Yinnon TA, Liu Z-Q (2015a). Domains Formation Mediated by Electromagnetic Fields in Very Dilute Aqueous Solutions: 1. Quantum Electrodynamic Aspects. WATER Journal 7: 33-47.
Yinnon TA, Liu Z-Q (2015b). Domains Formation Mediated by Electromagnetic Fields in Very Dilute Aqueous Solutions: 3. Quantum Electrodynamic Analyses of Experimental Data on Solutions of Weak Electrolytes and Non-electrolytes. WATER Journal in Press.
Yinnon TA, Elia V, Napoli E, Germano R, Liu ZQ (2015c). Water ordering induced by interfaces: an experimental and theoretical study. WATER Journal in Press.
Zubareva GM, Kargapolov AV, Yaguzhinskii LS (2003a). Fluctuations of pass band coefficients of water and salt solutions in the Infrared Region of the spectrum. Biofizika (Moscow) 48: 197-200.
Zubareva GM, Kargapolov AV, Laguzhinkii LS (2003b). Specific effect induced by subminute amounts of ascorbic acid on the fluctuation of transmission factor of water in the infrared spectral range. Dokl Biochem Biophys 388: 43–45.
Discussion with Reviewers
Reviewer: Is there a relationship between the “supra CD”, i.e. formation of super coherence domains and the possibility that aggregates of water molecules (negatively charged) can lead to the formation of solids via like-likes-like interaction? In other words, is the presence of a solid residue after evaporation at room pressure and temperature, which can be detected by Atomic Force Microscopy (AFM), an indication that we are in the presence of solid water under normal conditions?
Yinnon T and Liu Z-Q: To answer this question, we emphasize the following aspects of supra-CD in aqueous systems.
a) Within a coherence domain (CD), part or all of its molecules coherently transit between two states, e.g., electronic, rotational or plasma states. The photons involved in the transitions are condensed within the domain. CD may agglomerate in supra-domains. Supra-CD are not just ensembles of molecules but agglomerates of domains, like domains in liquid crystals. The energy gained by close packing of CD is related to the overlap of the evanescent tails of their photons’ condensed EMF. The overlap causes the coherent transitions of a CD’s molecules to be coherent with those ones in all other CD constituting the supra-CD. For example, in a supra-![]() , all H2O coherently oscillate between their electronic ground state and an excited state.
, all H2O coherently oscillate between their electronic ground state and an excited state.
b) CDplasma and IPDplasma are electrically neutral domains. Hence the energetics underlying their agglomeration into supra-domains is of the type mentioned in the previous paragraph.
c) CDrot have an electric dipole moment. Therefore the physics underlying CDrot agglomerating into supra-CDrot can be viewed as alignment of their electric dipoles, as well as that specified in paragraph (a).
d) ![]() , due to their quasi free electrons, easily get negatively charged. Data obtained with electrophoresis by the group of Konovalov and Ryzhkina (2014) indicate that the electrokinetic potential of
, due to their quasi free electrons, easily get negatively charged. Data obtained with electrophoresis by the group of Konovalov and Ryzhkina (2014) indicate that the electrokinetic potential of ![]() and supra-
and supra-![]() varies between -2 to -20 mV (Yinnon and Liu, 2015b). Energy gained by agglomeration of
varies between -2 to -20 mV (Yinnon and Liu, 2015b). Energy gained by agglomeration of ![]() into supra-
into supra-![]() at least includes that specified in paragraph (a). It is also conceivable that energy is gained by the cloud of quasi free electrons of each
at least includes that specified in paragraph (a). It is also conceivable that energy is gained by the cloud of quasi free electrons of each ![]() spreading over the whole supra-domain, and their quasi free protons reorganizing. However, to the best of our knowledge, this hypothesis has not yet been investigated.
spreading over the whole supra-domain, and their quasi free protons reorganizing. However, to the best of our knowledge, this hypothesis has not yet been investigated.
In regards to the above mentioned, for ![]() with their negative electric charges and for CDrot with their asymmetric electric charge distributions we can ponder if these agglomerate into, respectively, supra-
with their negative electric charges and for CDrot with their asymmetric electric charge distributions we can ponder if these agglomerate into, respectively, supra-![]() and supra-CDrot via “like likes like” interaction. This type of interaction refers to the phenomenon of attraction between like-charged particles. Such interaction counters our electrostatic theory based intuition. An often cited example of this phenomenon is the attraction between like-charged colloidal particles. Langmuir (1938), Feynman (1963) and others attributed the phenomenon to counter-ions situated in between the like-charged particles, i.e., “like-likes-like through an intermediate of unlikes”. Pollack and his co-workers recently provided experimental data confirming this attribution for like-charged beads in deionized water.
and supra-CDrot via “like likes like” interaction. This type of interaction refers to the phenomenon of attraction between like-charged particles. Such interaction counters our electrostatic theory based intuition. An often cited example of this phenomenon is the attraction between like-charged colloidal particles. Langmuir (1938), Feynman (1963) and others attributed the phenomenon to counter-ions situated in between the like-charged particles, i.e., “like-likes-like through an intermediate of unlikes”. Pollack and his co-workers recently provided experimental data confirming this attribution for like-charged beads in deionized water.
For ![]() agglomerated into supra-
agglomerated into supra-![]() it indeed is possible that the quasi free protons constitute the “intermediate of unlikes”. However, it also is possible that within a supra-
it indeed is possible that the quasi free protons constitute the “intermediate of unlikes”. However, it also is possible that within a supra-![]() , the quasi free electrons with their non-local quantum physics qualities spread over the whole supra-domain. As to experimental data providing any clues, we refer to the rounded domains with diameters of about 1×10⁻⁷ m – 5×10⁻⁷ m located within 10-4 m long strips, observed by transmission electron spectroscopy (see paragraph vi in the Discussion section). We inferred that the long strips are CDrot and the 1×10⁻⁷ to 5×10⁻⁷ m sized domains are
, the quasi free electrons with their non-local quantum physics qualities spread over the whole supra-domain. As to experimental data providing any clues, we refer to the rounded domains with diameters of about 1×10⁻⁷ m – 5×10⁻⁷ m located within 10-4 m long strips, observed by transmission electron spectroscopy (see paragraph vi in the Discussion section). We inferred that the long strips are CDrot and the 1×10⁻⁷ to 5×10⁻⁷ m sized domains are ![]() and supra-
and supra-![]() . Our inference implies that the diameters of supra-
. Our inference implies that the diameters of supra-![]() in SDVSASES reach maximal sizes of about 5×10⁻⁷ m. In serial diluted solutions of weak or non-electrolytic compounds with concentration in the range of 10-10 – 10-20 M, similar sized supra-domains were observed with DLS by the group of Konovalov and Ryzhkina (2014), which were shown to have characteristics of
in SDVSASES reach maximal sizes of about 5×10⁻⁷ m. In serial diluted solutions of weak or non-electrolytic compounds with concentration in the range of 10-10 – 10-20 M, similar sized supra-domains were observed with DLS by the group of Konovalov and Ryzhkina (2014), which were shown to have characteristics of ![]() (Yinnon and Liu, 2015b). The x80,0000 magnifications of the transmission electron spectroscopy images [see Figures 3d and f in Lo (1996a)] gives the impression that: each ~5×10⁻⁷ m supra-domain is a single entity; intra-domain water is present in between these supra-domains. The data hint that the quasi free electrons spread over the entire supra-
(Yinnon and Liu, 2015b). The x80,0000 magnifications of the transmission electron spectroscopy images [see Figures 3d and f in Lo (1996a)] gives the impression that: each ~5×10⁻⁷ m supra-domain is a single entity; intra-domain water is present in between these supra-domains. The data hint that the quasi free electrons spread over the entire supra-![]() .
.

Figure 2: A supra-CDrot. Its CDrot interact through “like likes like” interactions, with ![]() constituting the “intermediate of unlikes”. CDrot are symbolized by the elongated domains. Their blue arrows symbolize their electric dipole moments. The yellow-brown balls symbolize
constituting the “intermediate of unlikes”. CDrot are symbolized by the elongated domains. Their blue arrows symbolize their electric dipole moments. The yellow-brown balls symbolize ![]() .
.
For supra-CDrot, it is possible “like likes like” interactions underlie agglomeration of their CDrot, with ![]() or supra-
or supra-![]() playing the role of the “intermediate of unlikes”, as shown in Figure 2.
playing the role of the “intermediate of unlikes”, as shown in Figure 2.
A solid residue left over after evaporation at room pressure and temperature of serial diluted vigorous shaken aqueous solutions, to the best of our knowledge, was only reported for: solutions with concentrations above 10-10 M (Konovalov et al., 2014; Lo, 1996a); for solutions containing large amount of impurities due to their preparation in glass vessels, e.g., impurities like H2BO3, H4SiO4 and Na2CO3 present at concentrations in the range of 10-4 – 10-7 M (Elia et al., 2010). AFM showing that the residue left over after evaporation of these solutions contains domains with diameters reaching 10-5 m indeed indicates these are mainly composed of H2O. However, more data is required for concluding that the residue is “solid water under normal conditions”.
Recently, associates were stabilized in water by iterative agitating it with a Nafion membrane (Elia et al., 2013, 2015). The concentration of impurities was of the order of 10-6 M. The residue left over after evaporating the liquid at ambient conditions, or freeze-drying it, was investigated with various techniques. Analyses of the experimental data indicate that this solid residue indeed is “solid water under normal conditions” with the H2O being ordered in supra-CDrot containing supra-![]() , i.e., [supra-CDrot ] (Yinnon et al., 2015c). This solid water is a new phase of water, which has thermodynamic and spectral characteristics corresponding to those predicted by QED. Similar analyses of the residue left over after evaporating SDVSASES (containing only very few impurities) are called for to show this also is a solid phase of water at normal conditions with H2O all ordered in [supra-CDrot].
, i.e., [supra-CDrot ] (Yinnon et al., 2015c). This solid water is a new phase of water, which has thermodynamic and spectral characteristics corresponding to those predicted by QED. Similar analyses of the residue left over after evaporating SDVSASES (containing only very few impurities) are called for to show this also is a solid phase of water at normal conditions with H2O all ordered in [supra-CDrot].
DWR References
Feynman RP, Leighton RB, Sands M (1963). The Feynman Lecture on Physics. Addison-Wesley, Reading, MA, ch. 2, p. 2.
Langmuir I (1938). The Role of Attractive and Repulsive Forces in the Formation of Tactoids, Thixotropic Gels, Protein Crystals and Coacervates. J Chem Phys 6: 873-895