
 Water Ordering Induced by Interfaces: An Experimental and Theoretical Study
Yinnon TA1*, Elia V2, Napoli E2, Germano R3, Liu ZQ4
1 K. Kalia, D.N. Kikar Jordan 90666, Israel
2 University ‘‘Federico II’’ Universitario di Monte S’Angelo, Via Cintia, I-80126 Naples, Italy
3 PROMETE Srl, CNR Spin off, via Buongiovanni, 49 I-80046 San Giorgio a Cremano (Naples), Italy
4 Department of Physics Qufu Normal University, Qufu, 273165, China
*Correspondence E-mail: lwcdsrc@kalia.org.il
Key Words: Interfacial water; exclusion-zone water; water aggregates; ferroelectric ordering; domains.
Received Jan 13th 2015; Revised May 6th; Accepted June 24th; Published March 30th 2016; Online June 5th
For a list of abbreviations, see page 121-122.
Abstract
We study interfacial water by a novel method — we examine its stabilization in bulk water. Our study evidences that in an iterative immersion process [placing a hydrophilic membrane (Nafion®) in ultra-pure Milli-Q water kept in a plastic Petri capsule, manual agitations causing the liquid to lap against the membrane, removal and drying of the membrane, repetition of these steps] leads to ordering of part of the water molecules in the remnant liquid. It endows the remnant liquid with physicochemical characteristics similar to those of the membrane’s interfacial water. The orderings persist for macroscopic times (at least many days). These are very stable. These persist after drying or lyophilizing the remnant liquid, leaving a macroscopic solid residue at ambient temperature and pressure: a new solid phase of water. We report new experimental results (thermogravimetric measurements on the solid residues and density data on the liquid). These enable us to provide the first consistent explanations of previously reported characteristics of these orderings (observed by a wide variety of techniques, e.g., fluorescence microscopy, conductivity, pH for the liquid phase and IR spectroscopy on the solid residues). Our main findings are: (1) The up to hundreds of micrometers wide zone of ordered water near a hydrophilic surface, which excludes solutes and therefore in the literature termed “exclusion zone water”, is attributable to stabilization of liquid aggregates wherein water molecules are ferroelectric ordered. (2) The surface’s charge distribution and the ferroelectric ordering affect the electron cloud of the water molecules and lead to their organization in ~0.1 micrometers sized domains. (3) Critical temperatures for formation of the aggregates and domains, predicted in previous publications, are for the first time verified by our thermogravimetric data.
Article Outline
- Introduction
- Experimental Analyses
- Results and Discussion
- Conclusions
- Acknowledgements
- Discussion with Reviewers
- References
Introduction
Already for many years water adjacent to membranes, biological tissues or metal surfaces has been studied.1,2 Findings from past and current studies continue to have highly significant scientific and technological impact.3-9 For example processes near cell membranes or dynamics in micro water films.10-12 Many decades ago, experiments indicated that out to micrometers (µm) physical properties of water adjacent to biological membranes differ from those of bulk water.1 Recent experiments evidence a 10-5 – 10-4 m wide zone of ordered water adjacent to objects like hydrophilic membranes (e.g., Nafion membrane), reactive metal sheets, biological tissues, optical fibers and gels with charged or uncharged surfaces.2,3,5,8,9,13-23 a On inserting such objects into bulk water and adding particles like medium sized molecules (dyes, acid-base indicators), large molecules (proteins), bacteria, positively or negatively charged colloidal microspheres with diameters of 0.5 – 2.0 µm, these particles undergo active thermal motion away from the objects and do not diffuse back (even after days). The distancing of the particles from the object is due to formation of an interfacial water zone, composed of ordered water molecules (H2O). The zone excludes the particles and accordingly was termed exclusion zone (EZ).2,3,8,9 A sharp boundary exists between EZ water and its adjacent bulk water (~10% of EZ width). Tests showed the EZ is not due to pressure by polymer strands dissociating via reptation, pressure by entropic polymer brush or direct force resulting from moving phase boundaries.8 EZ water’s properties signify it is a kind of intermediate between ice and bulk water.23
a Hitherto, adjacent to hydrophobic membranes, no 10-5 – 10-4 m wide zone of ordered H2O has been identified, i.e., only out to ~10-9 m such membranes are known to affect H2O ordering.7
b Nafion is used broadly, e.g., as a proton-exchange membrane in electrodialysis, as a proton conductor in fuel cells, as a separator in electrolytic cells and as a mechanical actuator. Its interaction with water underlies many of its functions. It is composed of a carbon–fluorine backbone with perfluoro side chains containing sulfonic acid groups. The sulfonic acid groups confer hydrophilicity on an otherwise hydrophobic surface.
Recent experiments carried out in our group hint EZ water’s properties can be stabilized in bulk water. At ambient conditions, Nafion membranes b were washed five times with “ultra-pure” (Milli-Q) water. The electric conductivity of this water was 1-2 μS cm-1. A washed membrane was immersed in a plastic Petri capsule containing 10-20 ml of Milli-Q water. Over a period of several hours, manual agitations were applied repeatedly (tens of times) to allow the liquid to lap against the membrane. After some hours the membrane was removed from the Petri capsule and left to dry in air (1-24 hours). Subsequently the dried membrane was returned to the agitated water sample and the agitation, membrane-removal-drying-re-immersion cycle were repeated many times.24-26 The liquid remaining after removal of the membrane was denoted Iterative Nafionized Water (INW). This is a special type of water, i.e., water disturbed by interaction with a Nafion membrane. This “disturbed” water’s physicochemical properties considerably differ from those of Milli-Q water.24-26 For example, INW’s electric conductivity may reach ~1000 μS cm-1, i.e., three orders of magnitude larger than that of Milli-Q water. The differences are not due to the presence of Nafion or its EZ, because the membrane was removed from contact with the liquid. Neither are the difference attributable to impurities released by Nafion, the plastic capsule or any other origins.24-26, The procedural washing of the membrane before its immersion eliminates impurities. Nafion releases H3O+, F– and HSO–3 ions.5 The concentration of the latter gets reduced either by oxidation (HSO–4 formation) or by the chain reaction H3O+ + HSO–3 <-> H20 + H2SO3 -> 2H2O + SO2 ↑ .5
Ion Chromatography showed the concentration of F– is 2.8×10⁻⁶ M and that of HSO–4 is 2.5×10⁻⁶ M for an INW sample with conductivity of 305 μS cm-1.24 These concentrations cannot lead to such high conductivity.24,25 To ensure that neither organic nor biological contaminants underlie the special properties of INW, we employed matrix-assisted laser desorption/ionization time of flight (MALDI-TOF) analysis and Gas Chromatography, both coupled with Mass Spectrometry. Details of these measurements will be presented in a soon to be submitted manuscript by Elia, Yinnon, Oliva, Napoli, Germano, Bobba and Amoresano. These show that INW samples are not contaminated by biological or organic macromolecules. With INW and pure water having similar chemical composition, the significant differences in their physicochemical properties point to supramolecular organization of H2O induced by the “liquid lapping against the membrane disturbance”. Indeed, part of INW’s H2O being organized in aggregates was evidenced by light scattering, fluorescence microscopy, heat of mixing with basic (NaOH) solutions (![]() ) and atomic force microscopy on their solid residues.24-26 The aggregates persist over macroscopic times. For many days INW’s physicochemical characteristics significantly differ from those of pure water. These characteristics reveal its instability, far-from-equilibrium and hysteretic properties typical of dissipative self-organizing systems,24,25 e.g., the electric conductivities of some samples first increase and subsequently decrease, for others first decrease and then increase, while also continuous diminishments were observed. The increments and decrements in some cases reached ~50% of the value measured immediately after the last membrane removal step.24 In depth testing showed these changes are not attributable to contaminants.24-26 The aggregates are very stable, enabling their isolation.25 By removing bulk water from INW with a freeze-drying (lyophilization) technique, a large amount of solid is left over.25 Lyophilization of 20 ml INW samples yields about 1-2 mg of solid. The solid is stable at ambient conditions.25 It is a phase of water differing from that of aqueous vapor, liquid or ice phases. Its IR spectra show it is “modified” water.25 Its main OH-stretching band is significantly red shifted compared to that one of liquid water.25 Deconvolution of this band reveals that the higher energy component present in liquid water at around 3600 cm-1 is absent — a characteristic typical of ice.25 Moreover, it has a new absorption band at 2926 cm-1.25 Similarities between INW and EZ water, summarized in Table 1, evoke analogous ordering of part of their H2O, i.e., EZ water’s structural properties seem to be “impressed” in bulk water during the iterative Nafionization process.
) and atomic force microscopy on their solid residues.24-26 The aggregates persist over macroscopic times. For many days INW’s physicochemical characteristics significantly differ from those of pure water. These characteristics reveal its instability, far-from-equilibrium and hysteretic properties typical of dissipative self-organizing systems,24,25 e.g., the electric conductivities of some samples first increase and subsequently decrease, for others first decrease and then increase, while also continuous diminishments were observed. The increments and decrements in some cases reached ~50% of the value measured immediately after the last membrane removal step.24 In depth testing showed these changes are not attributable to contaminants.24-26 The aggregates are very stable, enabling their isolation.25 By removing bulk water from INW with a freeze-drying (lyophilization) technique, a large amount of solid is left over.25 Lyophilization of 20 ml INW samples yields about 1-2 mg of solid. The solid is stable at ambient conditions.25 It is a phase of water differing from that of aqueous vapor, liquid or ice phases. Its IR spectra show it is “modified” water.25 Its main OH-stretching band is significantly red shifted compared to that one of liquid water.25 Deconvolution of this band reveals that the higher energy component present in liquid water at around 3600 cm-1 is absent — a characteristic typical of ice.25 Moreover, it has a new absorption band at 2926 cm-1.25 Similarities between INW and EZ water, summarized in Table 1, evoke analogous ordering of part of their H2O, i.e., EZ water’s structural properties seem to be “impressed” in bulk water during the iterative Nafionization process.
Customary electrostatic interactions-only models are inadequate for explaining µm sized H2O ordering induced by hydrophilic or reactive metal surfaces.3,5,14,27,28 Surfaces affecting adjacent water out to distances of 10-5 – 10-4 m (i.e., several orders larger than the Debye length)29 imply electrostatic intermolecular forces (typically short-range with 10-10 – 10-9 m span) cannot generate EZ water.3 Moreover, exclusion of microspheres by a membrane was observed irrespective of whether these were positively or negatively charged, while the EZ width increases with microsphere charge.3,14 Molecular dynamics simulations solely including electrostatic interactions, carried out in tandem with experiments, show H2O ordering due to their polarization by polar surface groups occurs only up to few nm from hydrophilic surfaces.30-32 Electromagnetic phenomena (e.g., widening of EZ on irradiation and its narrowing on onset of darkness (not attributable to temperature changes)13 entail modeling effects of interfaces on H2O ordering warrants inclusion of long-range (10-7 – 10-4 m span) electrodynamic interactions. Indeed Del Giudice et al. succeeded to qualitatively explain several significant EZ water properties by explicitly accounting for electro-dynamic interactions.33-35 To the best of our knowledge no explanations for INW’s characteristics have been forwarded.
The goals of this paper are: (a) explaining INW’s characteristics; (b) analyzing EZ water’s structure and its “impression” in INW; (c) assessing “impression” of EZ water in bulk water as an effective method for examining such interfacial water. As to the importance of our study, it expounds H2O ordering highly relevant to plenteous natural and technological processes. It also complements previous studies on forces underlying EZ water.
To attain our goals, we report new experimental data:
• The density of INW and its correlation with the electric conductivity of this liquid. With our previous reported experimental results evidencing part of H2O in INW are organized in aggregates, INW’s density data can shed light on the aggregates’ density.
• The temporal evolution of the electric conductivity of INW obtained during 90 days, complementing our previous reported measurements covering 30 days.
• Thermogravimetric data of the solid residue left over after lyophilizing INW. Thermal Gravimetric Analysis (TGA) enables assessing the stability of the aggregates.
Based on our experimental data, in particular inspired by our TGA, we develop a model for INW. Quantum and classical physics electrodynamic properties of water derived since 1988 underlie our model. We do not derive any new properties. Instead our experimental data, as well as Del Giudice et al.’s EZ water model published in Ref. 33-35, enable us to “put the theoretical pieces together” and to propose a model for INW and its solid residues. Since the publication of Ref. 33-35, more experimental data on EZ water have been published. Our analyses of these enable us to provide additional support for the EZ water model.
As to the outline of this paper, firstly in the “Experimental section” we present our experimental protocols and new data. Next, in the “Theoretical section”: in its first three sub-sections, we concisely summarize the classical and quantum physics electro-dynamic properties of water relevant for our model; after that in its last two sub-sections, we present our INW model. Subsequently, in the “Discussion section”: in its first two sub-sections, we show that the experimental data confirm our INW model; in its last sub-section, we show that the results for EZ water obtained by Del Giudice et al. in 2010 and 201333-35 and our INW model also enable explaining experimental data on EZ water published after these dates. Conclusions and a list of abbreviations are presented at the end of the paper.

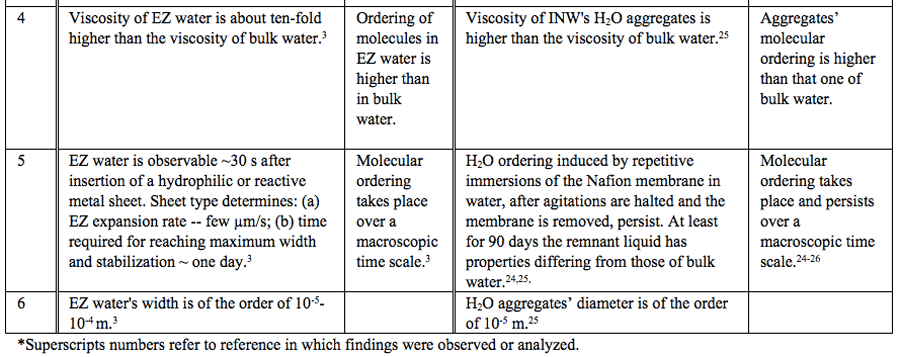
Table 1: Similar properties of EZ water and INW.
Experimental Analyses:
Materials and Methods
INW preparation protocol – The procedure and materials used for INW preparation are detailed in Reference 24. For clarity, we summarize them here. We used Nafion membranes with a surface of 60-120 cm2 and a thickness of 50-180 μm. We washed these ones five times with 20 ml of Milli-Q water. Subsequently we placed the membrane in an open Petri dish (made either of Pyrex glass or Polystyrene). We added 10-30 ml of Milli-Q water to the dish. The electric conductivity of the Milli-Q water was 1-2 μS cm-1. We manually stirred the liquid (2-3 mm of thickness) in such a way that it laps against the membrane. Then we measured the electric conductivity (χ) of the liquid. We manually turned the membrane over and resumed the stirring. The kinetic was quite variable. We carried out this procedure some tens of times, producing an increase of χ after each step. After some hours we removed the membrane from the Petri dish. We dried it in air for several hours. After that, we placed it again in the previously used water and repeated the stirring and turning over procedure. The iteration of the membrane immersion, agitations, removal and drying cycle was continued until we obtained a desired value of χ. As to the number of cycles required, our experiments indicate that INW’s typical properties are obtained already after the first contact with Nafion. χ is also influenced by the volume of the treated water, the size of the membrane and the fluctuating temporary environmental conditions. Smaller volumes lead to higher χ more rapidly. The maximum χ we obtained was about 1000 μS cm-1, which required something like several hundred cycles. INW’s preparation protocol does not lead to reproducible results, but only to repeatable phenomena.24-26 This is a characteristic of open systems residing in far from equilibrium states. It implies that it is impossible to prepare samples with the same values of their physicochemical variables, i.e., the samples we investigated are just a representative set.
Obtaining a solid residue from INW — We lyophilized some INW samples, i.e., we froze samples and subsequently reduced the surrounding pressure, thus allowing the frozen water in the samples to sublimate directly from the solid phase to the gas phase. Lyophilization of 20 ml of INW yields a large amount (1-2mg) of solid residue. Extensive analyses showed that the liquid INW is composed of H2O and contains negligible amounts of impurities.25 Consequently, the solid residue is a new phase of water.
Technique for measuring density of liquid INW — We measured the density (g cm-3) of INW and of Milli-Q water with a vibrating-tube digital density meter (model DMA 5000 by Anton Paar, Austria) with a precision of ±1×10⁻⁶ g cm-3 and an accuracy of ±5×10⁻⁶ g cm-3. We controlled the temperature of the water around the densitometer cell to ±0.001 K. We calibrated the densitometer periodically with dry air and pure water. We measured the density for INW samples having different electric conductivities.
Technique for measuring electric conductivity of liquid INW — The conductivity measurements, which are detailed in Reference 24, involve measuring conductivity at a controlled temperature of 25 ± 1° C, and further temperature-correcting using a pre-stored temperature compensation for pure water. We used a YSI 3200 conductometer with a conductivity cell constant of 1.0 cm-1. For a given conductivity measuring cell, the cell constant was periodically determined by measuring the conductivity of a KCl solution with a specific conductivity known to a high accuracy, at several concentrations and temperatures. The specific conductivity (μS cm-1) was then obtained as the product of the cell constant and the conductivity of the solution.
Technique for carrying out thermogravimetric analysis of the solid residue left over after lyophization of INW — We used the Netzsch TG209 apparatus with platinum crucible (pan), at a heating rate of 10°C/min under a nitrogen atmosphere (to prevent oxidation or other reactions). We put in the pan a small amount (2-10 mg) of the water in its solid phase, i.e., the solid residue obtained on lyophilization of INW. We measured its decomposition curve as a function of temperature.
Experimental Results
Density data — In Table 2, in the 2nd column, we present the difference between the density of our INW samples (ρINW) and the density of water (ρwater), i.e., (ρINW – ρwater). The table displays that the density of INW is larger than that of water.
Electric conductivity data — Table 3 and Figure 1 display the electric conductivity of INW and its temporal evolution at 25°C. ![]() (τ)=100-(
(τ)=100-(![]() –
– ![]() )x100/
)x100/![]() measured during τ days, for an exemplary set of five samples with different
measured during τ days, for an exemplary set of five samples with different ![]() , are displayed.
, are displayed. ![]() is the conductivity measured immediately after the last membrane removal step, i.e., at τ=0, and
is the conductivity measured immediately after the last membrane removal step, i.e., at τ=0, and ![]() that measured at τ days later. Factors affecting
that measured at τ days later. Factors affecting ![]() were specified above (see INW preparation protocol). Table 3 shows that the conductivity of INW is much larger than the 1-2 μS cm-1 value of our Milli-Q water. Figure 1 exhibits the significant differences between
were specified above (see INW preparation protocol). Table 3 shows that the conductivity of INW is much larger than the 1-2 μS cm-1 value of our Milli-Q water. Figure 1 exhibits the significant differences between ![]() (τ) minima, maxima and slopes of the various samples, exemplifying INW’s instability, far-from-equilibrium and hysteretic properties. Figure 2 displays the difference between the density of INW samples and that of Mili-Q water (ρINW– ρwater) as a function of the electric conductivity of the samples (χINW). These χINW values are presented in the third column of Table 2. Figure 2 reveals a linear correlation (R2=0.9404) between (ρINW – ρwater) and χINW. In previous studies we reported χINW also linear correlates with INW’s H2O aggregates’ sizes, pH and heat of mixing with NaOH.26 These linear correlations indicate a single cause underlie INW’s aforementioned variables.24-26 Figure 2 and Table 2 show that ρINW > ρwater. Hence the correlations points to the density of INW’s H2O aggregates being higher than that one of bulk water.
(τ) minima, maxima and slopes of the various samples, exemplifying INW’s instability, far-from-equilibrium and hysteretic properties. Figure 2 displays the difference between the density of INW samples and that of Mili-Q water (ρINW– ρwater) as a function of the electric conductivity of the samples (χINW). These χINW values are presented in the third column of Table 2. Figure 2 reveals a linear correlation (R2=0.9404) between (ρINW – ρwater) and χINW. In previous studies we reported χINW also linear correlates with INW’s H2O aggregates’ sizes, pH and heat of mixing with NaOH.26 These linear correlations indicate a single cause underlie INW’s aforementioned variables.24-26 Figure 2 and Table 2 show that ρINW > ρwater. Hence the correlations points to the density of INW’s H2O aggregates being higher than that one of bulk water.
, as a function of τ for 0 ≤ τ ≤ 90 days and their initial conductivity, (µS cm-1), defined in the text, at 298K.")
Figure 1: INW’s samples remaining conductivity, in percents, ![]() (τ), as a function of τ for 0 ≤ τ ≤ 90 days and their initial conductivity,
(τ), as a function of τ for 0 ≤ τ ≤ 90 days and their initial conductivity, ![]() (µS cm-1), defined in the text, at 298K.
(µS cm-1), defined in the text, at 298K.
 water, (ρINW- ρwater) (g·cm-3), as a function of the INW samples’ electric conductivity, χINW (µS cm-1).")
Figure 2: The difference between the density of INW samples and of ultra-pure(Milli-Q) water, (ρINW– ρwater) (g·cm-3), as a function of the INW samples’ electric conductivity, χINW (µS cm-1).
 water, (ρINW- ρwater) (g·cm-3), for INW samples with electric conductivity χINW (µS cm-1), at 298K. The average value and standard deviation of the electric conductivity of the ultra-pure (Milli-Q) water used for preparing INW, determined by measurements of 60 samples, are 1.1 ±0.1 µS cm-1.")
Table 2: The differences in density of INW and of ultra pure (Milli Q) water, (ρINW– ρwater) (g·cm-3), for INW samples with electric conductivity χINW (µS cm-1), at 298K. The average value and standard deviation of the electric conductivity of the ultra-pure (Milli-Q) water used for preparing INW, determined by measurements of 60 samples, are 1.1 ±0.1 µS cm-1.
, in percents at times 0≤ τ ≤90 days and their initial conductivity, (µS cm-1), defined in the text, at 298K.")
Table 3: INW’s samples remaining conductivity, ![]() (τ), in percents at times 0≤ τ ≤90 days and their initial conductivity, (µS cm-1), defined in the text, at 298K.
(τ), in percents at times 0≤ τ ≤90 days and their initial conductivity, (µS cm-1), defined in the text, at 298K.
Thermogravimetric data — Figure 3 exhibits a thermo-gravimetric graph of the solid residue left over after lyophilizing INW. It shows the decomposition curve of the solid residue as a function of temperature (T) at ambient pressure, i.e., it shows the percentage of weight loss of the solid sample as a function of T. Two crossovers are distinguishable, i.e., at T≈100 ºC and at T≈227 ºC. The total weight loss is achieved at around 650 ºC. (Since TGA data customarily are reported in degrees of Celsius units, in this paper T is reported in these units.) Persistence of the solid residue up to T≈650 ºC reveals the peculiar properties (ordering of H2O) in this new solid phase of water. Due to INW’s far-from-equilibrium and hysteretic properties,24-26 Figure 3’s curve is not quantitatively reproducible. However, it is qualitatively repeatable, i.e., Figure 3 is an exemplar and similar curves were obtained for other samples. Three regimes are discernible, pointing to three species constituting the solid residue. The first species, leaving the residue like hydration water when Tamb<T<~100 ºC (with Tamb symbolizing ambient temperature), has weight loss characteristics as those predicted by thermodynamics of randomly located, diffusing hydration H2O with their electric dipole moment randomly oriented and residing in their ground electronic state (here denoted H2OR), e.g., their removal is complete at 100 ºC.36 The second and third species, respectively, constituting ~40% and ~50% of the solid residue and leaving it like hydration water when ~100 ºC<T<~227 ºC and ~227 ºC<T<~650 ºC, evidence the residue contains two types of H2O orderings. This distinguishment between two different kinds of H2O orderings in the residue (which was not feasible with our previous reported experimental techniques) is crucial for modeling INW and explaining its physicochemical properties.

Figure 3: Thermographimetric graph of the solid residue left over after lyophilizing INW. The percentage of weight loss of the solid sample is plotted as a function of temperature in ºC.
Theory
We will carry out analyses of INW within the context of classical and quantum electrodynamics. As pointed out in the introduction, the electrostatic theories are inadequate for explaining surfaces inducing µm sized orderings of H2O in water at ambient conditions. The electrostatic theories assume that only electrostatic interactions between molecules [due to the short range (10-10 – 10-9 m span) electrostatic forces] have to be described explicitly. Concerning the long range (10-7 – 10-4 m span) electrodynamic interactions which are mediated by electromagnetic fields, the electrostatic theories assume that these ones only minimally affect liquid properties and accordingly they can be treated perturbatively or ignored. In contrast, the electrodynamic theories explicitly describe the electrodynamic for-ces. For water and other polar liquids, the quantum electrodynamic (QED) theories are rarely employed. Readers might not be familiar with these. Therefore, we will describe concisely their aspects relevant to our model. (A more elaborate synopsis on QED of aqueous systems is presented in Reference 73a.) We stress that in the following we do not derive any new features of electrodynamic theories. The sole aim of this theoretical section is presenting a model for INW. Some readers’ main interest might be our model’s explanations of the experiments; hence, at the end of the following two sub-sections, which contain several mathematical expressions, we summarize them in simple terms.
Assumptions underlying the INW model — We assume that the following phase transitions, triggered by immersing Nafion in water, underlie the formation of INW’s two types of H2O orderings:
1) A ferroelectric phase transition leading to formation of domains composed of ferroelectric ordered H2O, i.e., ferro-electric domains (FED). These domains in turn organize into aggregates (![]() ). H2O constituting
). H2O constituting ![]() we denote H2O
we denote H2O ![]() .
.
2) A phase transition resulting from dispersive forces mixing an excited electronic |b⟩ state of H2O with their ground electronic |0⟩ state. This transition leads to formation of domains, which in previous papers we denoted ![]() . H2O constituting
. H2O constituting ![]() we denote H2O
we denote H2O ![]() .
.
Ferroelectric orderings in bulk polar liquids — Already many decades ago, for some polar liquids, an instability alluding to a ferroelectric phase transition was identified within the context of classical electrodynamics.37-41 For an ensemble of dipoles, the polarization density P, polarization susceptibility χe and a macroscopic electric field E are related as P = χe E, according to the Clausius-Mossotti model derived in 1879.41 In Gaussian units χe=α/[ν-(4π/3)α]. Here α denotes the molecular polarizability and ν the volume per molecule. The model is applicable to many dielectrics, including some organic liquids, but it fails for others.41 For example, for water it predicts that the dielectric constant is negative, while the observed value is 80.41 The model also predicts that for ensembles with (4π/3)α>ν, these are globally unstable.37-40 (4π/3)α>ν may hold for liquids composed of highly polarizable molecules like water. For such liquids the model predicts a spontaneous transition to a ferroelectric phase at ambient conditions. The transition implies the formation of polar domains in the absence of an external electric field.39,40 Considering that bulk water is not residing in an ordered polarized state, the model in its original form obviously fails for water and some other polar liquids.37,38,41 The failure has been attributed to inadequate treatment of local interactions between neighboring (solvent) molecules and other correlations.37,38,40 Major research efforts led to improvements of the model. 37,38,40,42 As of yet, not all issues are fully settled within the context of classical electrodynamics.40 However, since 1988 quantum physics has predicted that such transitions are possible; for example quantum field theory, which explicitly describes correlations due to quantum and thermal fluctuations and it is regarded as the most accurate physics theory.43,44 Moreover, extensive computations, employing a variety of techniques [e.g., molecular dynamics simulations, density functional theory, Monte Carlo techniques] confirm ferroelectric ordering may occur in polar liquids.45-48 Before we will quote some quantum physics predictions relevant for our INW model, we will cite useful classical physics results.
Conditions for a ferroelectric phase transition in ensembles of highly polarizable molecules were recently derived by applying Landau and Lifshitz thermodynamic stability criteria to classical electro-dynamics.39 For temperature (T) above a critical temperature ![]() and density below a critical density, the molecules are in a disordered state. For T<
and density below a critical density, the molecules are in a disordered state. For T< ![]() and density above a critical density, a fraction of the molecules organize in ferroelectric domains (FED). These domains have polarization PFED. The magnitude PFED of PFED decreases with T, i.e., PFED=(µ/ν)[coth(µFFED/kBT)-(kBT/ µFFED)]. Here FFED is the magnitude of the local electric field FFED within a FED. µ is the magnitude of the molecule’s permanent dipole moment. kB is the Boltzmann constant. In the bulk of the ensemble, due to equilibrium rotational invariance, PFED are oriented randomly, i.e., there is no permanent polarization. For
and density above a critical density, a fraction of the molecules organize in ferroelectric domains (FED). These domains have polarization PFED. The magnitude PFED of PFED decreases with T, i.e., PFED=(µ/ν)[coth(µFFED/kBT)-(kBT/ µFFED)]. Here FFED is the magnitude of the local electric field FFED within a FED. µ is the magnitude of the molecule’s permanent dipole moment. kB is the Boltzmann constant. In the bulk of the ensemble, due to equilibrium rotational invariance, PFED are oriented randomly, i.e., there is no permanent polarization. For ![]() holds:
holds:
(1) ![]() =(4πµ2)/(9kB ν)
=(4πµ2)/(9kB ν)
Reduction of the ensemble’s spatial dimensions lowers ![]() .42 For two dimensional and quasi-two dimensional liquids, the expression in Equation 1 has to be divided by a term fquasi-2D.42
.42 For two dimensional and quasi-two dimensional liquids, the expression in Equation 1 has to be divided by a term fquasi-2D.42
For presenting relevant quantum physics predictions pertaining to ferroelectric phase transition in polar liquids, we focus on ensembles of N two-states rigid rotors with electric dipole d confined in a volume V. Such ensembles may comprise 10-5 – 10-4 m sized FED with polarization ![]() . 43 (
. 43 (![]() is the quantum analogue of PFED). The magnitude Pn of the ensemble’s polarization in direction n in natural units (=c=1) is: 43
is the quantum analogue of PFED). The magnitude Pn of the ensemble’s polarization in direction n in natural units (=c=1) is: 43
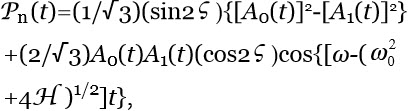
(2) Pn = (2/√3)A0(t)A1(t)cos(ω-ω0)t
Here A0(t) and A1(t), respectively, represent amplitudes of the rotors’ collective modes in their ground angular momentum l=0 and their excited angular momentum l=1 states, at microscopic time t. ωt signifies differences in phases of these modes. ω0 is the frequency of the l=0 ↔︎ l=1 transition. Equation 2 displays that the time average of Pn is zero, i.e., just as in the classical result cited above, in the bulk of the ensemble there is no net polarization. The thermodynamics of the rotors is influenced by the energy that a rotor gains by inclusion within a FED. This energy is an inverse function of the rotor’s distance from its domain’s center.33,34,44
For 0 K<T<![]() all rotors organize in FED (i.e., are rotorsFED). For
all rotors organize in FED (i.e., are rotorsFED). For ![]() <T<
<T<![]() , only a fraction of the rotors are organized in FED while others are not ferroelectric ordered (i.e., are rotorsnon-FED). For T>
, only a fraction of the rotors are organized in FED while others are not ferroelectric ordered (i.e., are rotorsnon-FED). For T>![]() only rotorsnon-FED persist.
only rotorsnon-FED persist. ![]() is the quantum analogue of
is the quantum analogue of ![]() . The critical temperature
. The critical temperature ![]() depends on the rotors’ electrostatic and electrodyamic interactions. For
depends on the rotors’ electrostatic and electrodyamic interactions. For ![]() <T<
<T<![]() : continually, some rotorsnon-FED adsorb on FED, while simultaneously rotorsFED desorb (more outer lying rotorsFED leave first). A FED’s diameter is an inverse function of T. For an open system: rotorsnon-FED may evaporate. The fraction of its rotorsnon-FED located within the interstices among FED versus the fraction of its evaporated rotorsnon-FED and the fraction of rotorsFED are determined by their chemical potentials.
: continually, some rotorsnon-FED adsorb on FED, while simultaneously rotorsFED desorb (more outer lying rotorsFED leave first). A FED’s diameter is an inverse function of T. For an open system: rotorsnon-FED may evaporate. The fraction of its rotorsnon-FED located within the interstices among FED versus the fraction of its evaporated rotorsnon-FED and the fraction of rotorsFED are determined by their chemical potentials.
For bulk water molecules μ≈1.855 Debye and at ambient conditions ν≈3×10-23 cm3.49 Insertion of these values into Equation 1 gives ![]() =
=![]() =887 ºC. For an ensemble of rigid rotors with electric dipole d and moment of inertia typical of H2O, at ambient conditions, the energy that a rotor gains on its inclusion in a FED is ~0.025 eV.34 For bulk water at ambient conditions kBT is of this order, implying thermal aggression prevents auto-organization of its H2O into stable FED.33,34
=887 ºC. For an ensemble of rigid rotors with electric dipole d and moment of inertia typical of H2O, at ambient conditions, the energy that a rotor gains on its inclusion in a FED is ~0.025 eV.34 For bulk water at ambient conditions kBT is of this order, implying thermal aggression prevents auto-organization of its H2O into stable FED.33,34
Summing up: Recent developments in quantum and classical electrodynamics, in particular the quantum field theory explicitly accounting for quantum fluctuations,43,44 confirm the Clausius-Mossotti model’s prediction of an instability which might lead to a ferroelectric phase transition in ensembles of certain types of dipoles. These approaches succeeded to resolve puzzles raised by the Clausius-Mossotti model concerning water and other liquids composed of highly polarizable molecules. For example, the recent approaches succeeded to delineate the conditions for ferroelectric ordering. Whenever an ensemble of H2O are induced to organize into FED by some means, the ferroelectric ordering may persist up to the critical temperature ![]() =887 ºC. However, on inserting these FED into bulk water at ambient conditions, these are unstable. H2O desorb from FED. In a closed system these desorbed H2O locate in the interstices among FED. For an open system, the desorbed H2O may reside in the interstices among FED or evaporate. The fraction of H2O located within the interstices in between FED, versus the fractions of evaporated ones and the fraction of H2O organized in FED are determined by their chemical potentials.
=887 ºC. However, on inserting these FED into bulk water at ambient conditions, these are unstable. H2O desorb from FED. In a closed system these desorbed H2O locate in the interstices among FED. For an open system, the desorbed H2O may reside in the interstices among FED or evaporate. The fraction of H2O located within the interstices in between FED, versus the fractions of evaporated ones and the fraction of H2O organized in FED are determined by their chemical potentials.
Ferroelectric ordering of H2O induced by interfaces — Immersing objects, e.g., a membrane or a reactive metal sheet, in an ensemble of polar molecules may stabilize FED. Interfaces alter FFED, PFED and Gibbs energy in their adjacent liquid.50,51 Analyses of such alterations are best carried out by quantum physics.44 For example it predicts that objects with an asymmetric charge distribution add a term H=-d.E to a rigid rotors ensemble’s potential energy.43 E is the electric field due to the objects. H breaks the dipole rotational symmetry. H also augments the energy a rotor gains on its inclusions within FED. Hence H may induce FED organizing in ferroelectric aggregates (AGFED) surrounding the object, resulting in a permanent polarization Pn with magnitude:
(3) 
where ![]() , with time average:
, with time average:
(4) ![]() ,
,
with ![]() and
and ![]() , respectively, the time average of [A0(t)]2 and [A1(t)]2. Equation 4 shows that a net polarization implies a non-zero differences in the l=0 and l=1 populations, i.e., a state different from the [A0(t)]2≈[A1(t)]2 typifying the equilibrium Boltzmann distribution within the bulk of the ensemble. As derived in Reference 43,
, respectively, the time average of [A0(t)]2 and [A1(t)]2. Equation 4 shows that a net polarization implies a non-zero differences in the l=0 and l=1 populations, i.e., a state different from the [A0(t)]2≈[A1(t)]2 typifying the equilibrium Boltzmann distribution within the bulk of the ensemble. As derived in Reference 43, ![]() ≠0 entails a non-zero time average of the amplitude UFED(t) of the electromagnetic field UFED coupled to the l=0 ↔︎ l=1 transition, signifying photons mediating dipole-dipole interactions condense within FED.UFED affects the energy a rotor gains on its inclusions within FED.
≠0 entails a non-zero time average of the amplitude UFED(t) of the electromagnetic field UFED coupled to the l=0 ↔︎ l=1 transition, signifying photons mediating dipole-dipole interactions condense within FED.UFED affects the energy a rotor gains on its inclusions within FED.
Summing up: Equations 3 and 4 imply that immersing objects with sufficiently strong asymmetric charge distribution in polar liquids may trigger a ferroelectric phase transition. In other words, the immersion stabilizes FED and causes alignment of their dipoles, i.e., formation of AGFED.43 As to water at ambient conditions, it has been shown that immersion of objects in bulk water may stabilize 10-5 – 10-4 m sized FED which form ![]() .52,53
.52,53
Numerous phenomena and computations conform to ![]() adjacent to interfaces, e.g.: orientation relaxation times for interfacial H2O are slower (up to 7 fold) than that one of bulk water;54 characteristics of electro-hydro-dynamical flows induced in water films are due to FED;11,55,56 molecular dynamics, Monto Carlo and Density Functional Theory computations show near walls polar liquids are ferroelectric ordered and in nanotubes immersed in water at ambient conditions H2O are ferroelectric ordered.47,57
adjacent to interfaces, e.g.: orientation relaxation times for interfacial H2O are slower (up to 7 fold) than that one of bulk water;54 characteristics of electro-hydro-dynamical flows induced in water films are due to FED;11,55,56 molecular dynamics, Monto Carlo and Density Functional Theory computations show near walls polar liquids are ferroelectric ordered and in nanotubes immersed in water at ambient conditions H2O are ferroelectric ordered.47,57
Formation of ![]() domains induced by dispersive interactions — UV-vis absorption by INW and EZ water (see Table 1 line 1) signifies interfaces like hydrophilic membranes or reactive metal sheets alter electronic clouds of adjacent H2O. Alterations may be due to the non-zero polarization discussed in the previous section, i.e.,
domains induced by dispersive interactions — UV-vis absorption by INW and EZ water (see Table 1 line 1) signifies interfaces like hydrophilic membranes or reactive metal sheets alter electronic clouds of adjacent H2O. Alterations may be due to the non-zero polarization discussed in the previous section, i.e., ![]() ≠0.34 Long range dispersive forces too may be responsible.34,58,59 Recently dispersion-corrected Density Functional Theory computations showed that these dispersion forces non-negligibly influence condensed matter structure, e.g., water adjacent to metal surfaces and other H2O ensembles.27,28,60,61
≠0.34 Long range dispersive forces too may be responsible.34,58,59 Recently dispersion-corrected Density Functional Theory computations showed that these dispersion forces non-negligibly influence condensed matter structure, e.g., water adjacent to metal surfaces and other H2O ensembles.27,28,60,61
Quantum physics, in particular quantum field theory, indeed predicts that inclusion in the Hamiltonian of a term explicitly describing dispersive interactions leads to an instability which may cause a temperature and density dependent continuous phase transition.62,63 For an ensemble of molecules with an electronic structure typical of H2O and on ignoring vibrational and rotational degrees of freedom, the phase transition might trigger formation of domains (![]() ) wherein H2O
) wherein H2O![]() are tetrahedral coordinated.58,64,65 Its H2O
are tetrahedral coordinated.58,64,65 Its H2O![]() reside in a state which is a superposition of the H2O’s electronic ground |0⟩ state (with a weight of ~87%) and its excited electronic |b⟩ state (with a weight of ~13%).58,65 The size of
reside in a state which is a superposition of the H2O’s electronic ground |0⟩ state (with a weight of ~87%) and its excited electronic |b⟩ state (with a weight of ~13%).58,65 The size of ![]() is of the order of 10-7 m; it is determined by the wavelength
is of the order of 10-7 m; it is determined by the wavelength ![]() pertaining to the |0⟩ ↔︎ |b⟩ transition.58 One electron of a H2O residing in its |b⟩ state is almost free (binding energy ≈0.4 eV), i.e., a
pertaining to the |0⟩ ↔︎ |b⟩ transition.58 One electron of a H2O residing in its |b⟩ state is almost free (binding energy ≈0.4 eV), i.e., a ![]() is a pool of ~106 quasi-free electrons and correspondingly an ensemble of quasi free protons (the partners of the quasi-free electrons).34,65 The molecular volume of a H2O in its |b⟩ state is larger than in its |0⟩ state. Hence the density of
is a pool of ~106 quasi-free electrons and correspondingly an ensemble of quasi free protons (the partners of the quasi-free electrons).34,65 The molecular volume of a H2O in its |b⟩ state is larger than in its |0⟩ state. Hence the density of ![]() is less than that of an ensemble of H2O residing in their |0⟩ state.58 The density of a
is less than that of an ensemble of H2O residing in their |0⟩ state.58 The density of a ![]() equals 0.92 g/cm3. Within a
equals 0.92 g/cm3. Within a ![]() , photons intermediating the dispersive interactions are condensed.58 These photons’ electromagnetic field we denote here as U
, photons intermediating the dispersive interactions are condensed.58 These photons’ electromagnetic field we denote here as U![]() . Energetically it is favorable that the evanescent tails of neighboring U
. Energetically it is favorable that the evanescent tails of neighboring U![]() overlap; as a result
overlap; as a result ![]() tend to assemble in supra-domains (supra-
tend to assemble in supra-domains (supra-![]() ).33,34,58 A supra-
).33,34,58 A supra-![]() is an assemblage in which each domain persist as an independent one, like molecular domains in liquid crystals. The energy that a molecule gains by inclusion within
is an assemblage in which each domain persist as an independent one, like molecular domains in liquid crystals. The energy that a molecule gains by inclusion within ![]() is an inverse function of its distance from the center of this domain. At T=273 K this energy is ~0.17 eV for an H2O
is an inverse function of its distance from the center of this domain. At T=273 K this energy is ~0.17 eV for an H2O![]() located at the boundary of a
located at the boundary of a ![]() .58,65
.58,65
Summing up: The main properties of ![]() relevant for our study are:58,65
relevant for our study are:58,65
(a) ![]() only exist at temperatures below the critical temperature .
only exist at temperatures below the critical temperature .
(b) For T<-93 ºC, all molecules are organized in ![]() .
.
(c) For -93 ºC<T<227 ºC: a temperature dependent fraction of the molecules form ![]() ; others reside in the |0⟩ state (i.e. these are H2OR). In a closed system, all H2OR move within interstices between . Continually, some H2OR adsorb on
; others reside in the |0⟩ state (i.e. these are H2OR). In a closed system, all H2OR move within interstices between . Continually, some H2OR adsorb on ![]() , while simultaneously H2O
, while simultaneously H2O![]() desorb (more outer lying H2O
desorb (more outer lying H2O![]() leave first), causing a ~10-14 s timescale “flickering” domain landscape. Thus
leave first), causing a ~10-14 s timescale “flickering” domain landscape. Thus ![]() observation requires very fast resolution probes.
observation requires very fast resolution probes. ![]() ’s diameter is an inverse function of temperature. For an open system, H2OR may evaporate. The fraction of its H2OR located within the interstices among
’s diameter is an inverse function of temperature. For an open system, H2OR may evaporate. The fraction of its H2OR located within the interstices among ![]() s versus the fraction of its evaporated H2OR and the fraction of H2O
s versus the fraction of its evaporated H2OR and the fraction of H2O![]() are determined by their chemical potentials. c,d
are determined by their chemical potentials. c,d
(d) Immersing objects (e.g., membranes or reactive metal sheets) in water may stabilize ![]() (i.e., reduce their “flickering”) and enhance supra-
(i.e., reduce their “flickering”) and enhance supra-![]() formation. Two possible mechanisms leading to such stabilization and enhancement were proposed:
formation. Two possible mechanisms leading to such stabilization and enhancement were proposed:
1. The dipole movement Pn of the ![]() stabilized by the interface induce electric dipole moments in the quasi-free electron clouds of
stabilized by the interface induce electric dipole moments in the quasi-free electron clouds of ![]() . The interactions between these dipoles may stabilize
. The interactions between these dipoles may stabilize ![]() and supra-
and supra-![]() .73 H2O can reside in a superposition of the rotational and electronic excited states, respectively, typifying the molecules constituting
.73 H2O can reside in a superposition of the rotational and electronic excited states, respectively, typifying the molecules constituting ![]() and
and ![]() . Therefore, the 10-5-10-4 m sized
. Therefore, the 10-5-10-4 m sized ![]() may contain numerous ~10-7 m sized
may contain numerous ~10-7 m sized ![]() or supra-
or supra-![]() .33,34 We denote
.33,34 We denote ![]() containing supra-
containing supra-![]() as
as ![]() ⟨supra-
⟨supra-![]() ⟩. Support for this mechanism was provided by analyses of EZ water and the water bridge, showing their phenomenological characteristics conform to those of
⟩. Support for this mechanism was provided by analyses of EZ water and the water bridge, showing their phenomenological characteristics conform to those of ![]() ⟨supra-
⟨supra-![]() ⟩.33-35,75 More evidence for EZ water being composed of
⟩.33-35,75 More evidence for EZ water being composed of ![]() ⟨supra-
⟨supra-![]() ⟩ will be presented in the Discussion section.
⟩ will be presented in the Discussion section.
2. Electrical particles constituting the object perform plasma oscillations around their equilibrium positions. Ambient electromagnetic fields may correlate the oscillations, resulting in identical charged particles oscillating in unison — see Reference 74, chapter 5. At the object-water interface, plasma oscillations of identical surface charges may resonate with the plasma oscillations of adjacent quasi-free electrons or quasi-free protons, resulting in ![]() stabilization.34 The impact of surface particles on adjacent H2O, underlying aforementioned mechanism, corresponds to that one identified by dispersion-corrected Density Functional Theory simulations. These revealed that non-local correlations between metal surface particles and H2O contribute more to stabilization of interfacial water than intra-H2O ones.27
stabilization.34 The impact of surface particles on adjacent H2O, underlying aforementioned mechanism, corresponds to that one identified by dispersion-corrected Density Functional Theory simulations. These revealed that non-local correlations between metal surface particles and H2O contribute more to stabilization of interfacial water than intra-H2O ones.27
INW model
Based on the H2O ensembles’ characteristics detailed above, we conjecture that the following processes occur during INW preparation, which we schematically picture in Figure 4:
1) As first pointed out by Del Giudice et al., 33-35 immersing the Nafion membrane in water triggers a ferroelectric phase transition. The transition leads to formation of ferroelectric domains (FED) adjacent to the membrane (see Figures 4a and b). These domains aggregate, i.e., form ![]() . The width of the zone of ferroelectric ordered H2O is at least that one of the order of the FED diameter, i.e., 10-5 – 10-4 m. The polarization due to
. The width of the zone of ferroelectric ordered H2O is at least that one of the order of the FED diameter, i.e., 10-5 – 10-4 m. The polarization due to ![]() triggers a phase transition resulting in part of the H2O
triggers a phase transition resulting in part of the H2O![]() to organize in stable
to organize in stable ![]() . These
. These ![]() may agglomerate into supra-
may agglomerate into supra-![]() . As a result, the ~10-5-10-4m sized
. As a result, the ~10-5-10-4m sized ![]() may contain numerous ~10-7 m sized
may contain numerous ~10-7 m sized ![]() or supra-
or supra-![]() . In other words, these are
. In other words, these are ![]() ⟨supra-
⟨supra-![]() ⟩ (see Figure 4b). Dispersive interactions between the membrane and H2O also may stabilize
⟩ (see Figure 4b). Dispersive interactions between the membrane and H2O also may stabilize ![]() , i.e., these
, i.e., these ![]() are not contained within an H2O
are not contained within an H2O![]() (see Figure 4b).
(see Figure 4b).
2) Since a ~600 µm wide EZ adjacent to a Nafion sheet forms within 10 min after its immersion in water (with the EZ expanding further but slower to about 1 mm within a day),3 we assume the following: our repeated perturbations of water containing a Nafion membrane (by agitating it and causing it to lap against the membrane) ruptures the loosely bounded ![]() ⟨supra-
⟨supra-![]() ⟩ constituting the EZ water adjacent to the membrane, and disperse its clumps in neighboring bulk water (see Figure 4c).
⟩ constituting the EZ water adjacent to the membrane, and disperse its clumps in neighboring bulk water (see Figure 4c).
3) Immediately after rupturing of the EZ, it grows again.
4) Iteration of the reimmersion-agitations-membrane-removal-drying cycle enhances the concentration of the chunks of ![]() ⟨supra-
⟨supra-![]() ⟩ and these affect the liquid’s physicochemical properties (compare Figures 4c and d — the latter displays a higher concentration of
⟩ and these affect the liquid’s physicochemical properties (compare Figures 4c and d — the latter displays a higher concentration of ![]() ⟨supra-
⟨supra-![]() ⟩).
⟩).
Model for the residue of INW
On evaporation of INW at temperatures T≤100 ºC or on its lyophilization, the H2O not organized in ![]() or
or ![]() ( i.e., the H2OR) leave the liquid. Hence
( i.e., the H2OR) leave the liquid. Hence ![]() ⟨supra-
⟨supra-![]() ⟩ compose the solid residue left over after the removal of all the bulk water from INW. This solid residue is a new phase of water. Its thermodynamics is determined by that one of
⟩ compose the solid residue left over after the removal of all the bulk water from INW. This solid residue is a new phase of water. Its thermodynamics is determined by that one of ![]() and
and ![]() . On heating of the solid residue, which was left over after lyophilizing INW, the following happens:
. On heating of the solid residue, which was left over after lyophilizing INW, the following happens:
(a) For T≤100 ºC, few of the solid residue’s H2O![]() and H2O
and H2O![]() desorb, respectively, from
desorb, respectively, from ![]() and
and ![]() . These molecules become H2OR and like hydration H2O leave the residue.
. These molecules become H2OR and like hydration H2O leave the residue.
(b) At temperatures less than the critical temperature for ![]() formation, i.e.,
formation, i.e., ![]() = 227 ºC, heating of the solid residue leads to outer-lying H2O
= 227 ºC, heating of the solid residue leads to outer-lying H2O![]() to desorb. This happens because the desorption energy of H2O
to desorb. This happens because the desorption energy of H2O![]() is an inverse function of their distance from the center of their
is an inverse function of their distance from the center of their ![]() .58 These H2O
.58 These H2O![]() become H2OR and like hydration water leave the residue.
become H2OR and like hydration water leave the residue.
(c) At temperatures less than the critical temperature for ![]() stabilization, i.e., ,
stabilization, i.e., ,![]() heating of the solid residue leads to outer-lying H2O
heating of the solid residue leads to outer-lying H2O![]() to desorb. This arises from the desorption energy of H2O
to desorb. This arises from the desorption energy of H2O![]() being an inverse function of their distance from the center of their
being an inverse function of their distance from the center of their ![]() .33,34,44,74 These H2O
.33,34,44,74 These H2O![]() become H2OR. Like hydration water, these H2OR leave the residue. Equation 1 specifies the expression for
become H2OR. Like hydration water, these H2OR leave the residue. Equation 1 specifies the expression for ![]() . For bulk water
. For bulk water ![]() =887 ºC. However, as mentioned above,
=887 ºC. However, as mentioned above,![]() of two dimensional and quasi-two dimensional liquids is lower than that one of bulk liquid, i.e.,
of two dimensional and quasi-two dimensional liquids is lower than that one of bulk liquid, i.e., ![]() has to be divided by a term fquasi-2D.42 The zone forming adjacent to Nafion can be regarded as a quasi-two dimensional slab. The same holds for the few milligrams of solid residue left over at the bottom of the flask after lyophilization of INW. Hence, our model predicts that on heating the solid residue, it will persist up to a temperature of 887 ºC divided by fquasi-2D.
has to be divided by a term fquasi-2D.42 The zone forming adjacent to Nafion can be regarded as a quasi-two dimensional slab. The same holds for the few milligrams of solid residue left over at the bottom of the flask after lyophilization of INW. Hence, our model predicts that on heating the solid residue, it will persist up to a temperature of 887 ºC divided by fquasi-2D.
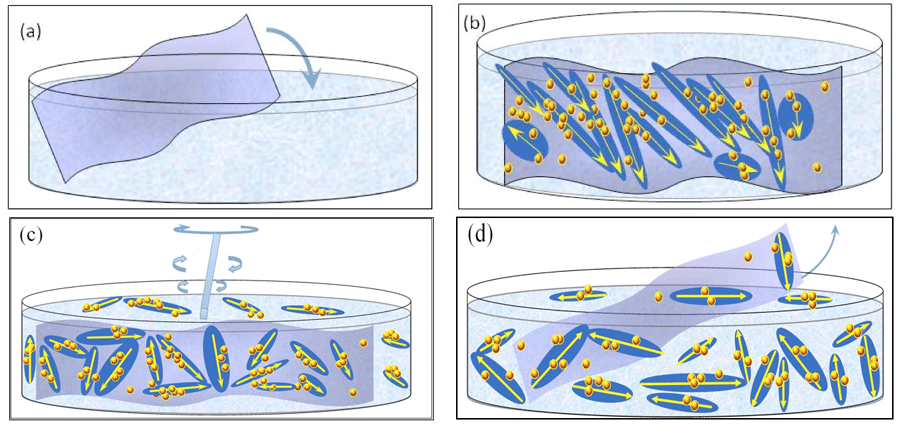
Figure 4: Schematic picture of our INW model: (a) Immersion of Nafion sheet in water. (b) Stabilization of ![]() ⟨supra-
⟨supra-![]() ⟩ and
⟩ and ![]() on Nafion. The large elongated domains represent 10-5 – 10-4 m sized
on Nafion. The large elongated domains represent 10-5 – 10-4 m sized ![]() with their electric dipole moments represented by yellow arrows. The yellow-brown colored balls and their agglomerates, located within the elongated domains, represent, respectively, ~10-7 m sized
with their electric dipole moments represented by yellow arrows. The yellow-brown colored balls and their agglomerates, located within the elongated domains, represent, respectively, ~10-7 m sized ![]() and supra-
and supra-![]() stabilized by
stabilized by ![]() . Each
. Each ![]() ⟨supra-
⟨supra-![]() ⟩ contains lots of
⟩ contains lots of ![]() , but for keeping the picture simple only few are portrayed. The yellow-brown colored balls, which are located on the membrane but outside the elongated domains, are
, but for keeping the picture simple only few are portrayed. The yellow-brown colored balls, which are located on the membrane but outside the elongated domains, are ![]() stabilized by dispersive interactions between H2O and the membrane. (c) By manually agitating the liquid, with agitations pictured by a rotating rod,
stabilized by dispersive interactions between H2O and the membrane. (c) By manually agitating the liquid, with agitations pictured by a rotating rod, ![]() ⟨supra-
⟨supra-![]() ⟩ get dispersed in the liquid. (d) After removal of the Nafion membrane, INW contains the dispersed
⟩ get dispersed in the liquid. (d) After removal of the Nafion membrane, INW contains the dispersed ![]() ⟨supra-
⟨supra-![]() ⟩. The various domains are not represented according to their realistic scale ratios.
⟩. The various domains are not represented according to their realistic scale ratios.
Discussion
As we discuss below, our experimental thermogravimetric analyses (TGA) and density results presented above, together with our experimental data obtained by other techniques reported in our previous publications,24-26 verify several predictions of the electrodynamic theory of polar liquids in general and water in particular. Moreover, these support our INW model and confirm the model for EZ water proposed by Del Giudice et al. in References 33-35.
Evidence for ![]() and
and ![]() in the solid residue left over after lyophilizing INW
in the solid residue left over after lyophilizing INW
Evidence revealed by TGA — We recall that the theory predicts that ![]() form below the critical temperature
form below the critical temperature ![]() =227 ºC.58 It also predicts that
=227 ºC.58 It also predicts that ![]() may form below the critical temperature
may form below the critical temperature ![]() . For bulk water,
. For bulk water, ![]() has been estimated as 887 ºC.39 For quasi-two-dimensional or two dimensional H2O ensembles (like EZ water or a piece of the 1-2 mg solid residue left over after lyophilizing INW),
has been estimated as 887 ºC.39 For quasi-two-dimensional or two dimensional H2O ensembles (like EZ water or a piece of the 1-2 mg solid residue left over after lyophilizing INW), ![]() is somewhat lower,42 i.e., 887 ºC m divided by fquasi-2D. Our TGA results presented in Figure 3 show the decomposition curve of the solid residue as a function of T, i.e., the percentage of its weight loss as a function of T. With
is somewhat lower,42 i.e., 887 ºC m divided by fquasi-2D. Our TGA results presented in Figure 3 show the decomposition curve of the solid residue as a function of T, i.e., the percentage of its weight loss as a function of T. With ![]() =227 ºC and
=227 ºC and ![]() = 887 ºC divided by fquasi-2D, Figure 3 indicates that the H2O constituting ~40% of the solid residue and leaving it when ~100 ºC<T<~227 ºC are H2O
= 887 ºC divided by fquasi-2D, Figure 3 indicates that the H2O constituting ~40% of the solid residue and leaving it when ~100 ºC<T<~227 ºC are H2O![]() , while those leaving it when ~227 ºC<T<~650 ºC are H2O
, while those leaving it when ~227 ºC<T<~650 ºC are H2O![]() . In support of these attributions we note:
. In support of these attributions we note:
i. The measured monotonically weight loss of the solid sample as function of T for ~100 ºC<T<~227 ºC is commensurate with quantum physics’ derived ![]() characteristics. Reference 58 predicts that for an ensemble of H2O at ambient pressures and at T>-93 ºC, the fraction of H2O organized in
characteristics. Reference 58 predicts that for an ensemble of H2O at ambient pressures and at T>-93 ºC, the fraction of H2O organized in ![]() monotonically decreases with T. It also predicts
monotonically decreases with T. It also predicts ![]() persist up to
persist up to ![]() = 227 ºC. Computation of
= 227 ºC. Computation of ![]() = 227 ºC required fitting of one parameter (δES) within the from first principles derived quantum description of a H2O ensemble containing
= 227 ºC required fitting of one parameter (δES) within the from first principles derived quantum description of a H2O ensemble containing ![]() .58 δES =0.022 eV represents the effect of the long range dispersive interactions underlying
.58 δES =0.022 eV represents the effect of the long range dispersive interactions underlying ![]() formation on the short range electro-static interactions between H2O. δES was fitted so that the sharp increases in the derivatives of thermodynamic quantities, e.g., specific heat and compressibility, predicted by the model coincides with the experimentally observed ones at about -43 ºC. Our measured weight loss of the solid residue as function of T for 100 ºC<T<~227 ºC and
formation on the short range electro-static interactions between H2O. δES was fitted so that the sharp increases in the derivatives of thermodynamic quantities, e.g., specific heat and compressibility, predicted by the model coincides with the experimentally observed ones at about -43 ºC. Our measured weight loss of the solid residue as function of T for 100 ºC<T<~227 ºC and ![]() = 227 ºC, to the best of our knowledge, is the first verification of Reference 58’s predictions.
= 227 ºC, to the best of our knowledge, is the first verification of Reference 58’s predictions.
ii. For moderately polar quasi-two dimensional liquids, e.g., with density and molecular electric dipole values like those of chloroform, ~1.16<fquasi-2D<~1.44 (for ![]() expressed in ºC).42 For water fquasi-2D has not yet been computed. However, dividing
expressed in ºC).42 For water fquasi-2D has not yet been computed. However, dividing ![]() =887 ºC of bulk water by the aforementioned fquasi-2D values gives for quasi-two dimensional water 608 ºC<
=887 ºC of bulk water by the aforementioned fquasi-2D values gives for quasi-two dimensional water 608 ºC<![]() <753 ºC. Persistence of the solid residue up to the strikingly high T≈650 ºC value falling in this range, thus indeed alludes to this residue containing
<753 ºC. Persistence of the solid residue up to the strikingly high T≈650 ºC value falling in this range, thus indeed alludes to this residue containing ![]() . To the best of our knowledge this is the first experimental sign of the predicted high
. To the best of our knowledge this is the first experimental sign of the predicted high ![]() value and its reduced value in quasi-two dimensional systems.
value and its reduced value in quasi-two dimensional systems.
iii. The bumps in the nearly linear slope of Figure 3 in the ~227 ºC<T<~650 ºC regime are ascribable to variations in the energy required for desorption of H2O![]() from the borders of
from the borders of ![]() . The variations are attributable to topological defects, e.g., local disorder. Auto-agglomeration of FED into
. The variations are attributable to topological defects, e.g., local disorder. Auto-agglomeration of FED into ![]() is often hindered by local potential energy barriers hampering a FED ensemble’s approach toward its global stationary structure, leading to topological defects — see Reference 53 Section 3.4.1.
is often hindered by local potential energy barriers hampering a FED ensemble’s approach toward its global stationary structure, leading to topological defects — see Reference 53 Section 3.4.1.
Evidence revealed by spectroscopic data — Our IR spectra of the solid residue left over after lyophilizing INW also are commensurate with it containing ![]() and
and ![]() :
:
i. Our deconvolution of the OH stretching peak between 2880 and 3800 cm-1 exhibits maxima at ~3400, ~3200 and 2926 cm-1.25 The maxima at ~3400 and ~3200 cm-1 were also observed for bulk water and ice-Ih and ascribed to H2O![]() .76-79
.76-79
ii. The absence of a high energy maximum around 3600 cm-1 indicates the solid residue contains no significant amounts of H2O that are not organized in ![]() or
or ![]() , i.e., H2OR. Such a maximum is typical for water vapor and also observed for bulk water, but non-existent for ice-Ih;76-79 accordingly it has been assigned to H2OR.77,79 Still Figure 3’s TGA indicates that H2O leave the solid residue for T≤100 ºC. These H2O most likely are former H2O
, i.e., H2OR. Such a maximum is typical for water vapor and also observed for bulk water, but non-existent for ice-Ih;76-79 accordingly it has been assigned to H2OR.77,79 Still Figure 3’s TGA indicates that H2O leave the solid residue for T≤100 ºC. These H2O most likely are former H2O![]() and H2O
and H2O![]() , which desorbed from, respectively,
, which desorbed from, respectively,![]() and
and ![]() during heating of the solid residue. After their desorption, these H2O moved randomly within the interstices of these domains until thermodynamic conditions facilitated their evaporation. Such H2O
during heating of the solid residue. After their desorption, these H2O moved randomly within the interstices of these domains until thermodynamic conditions facilitated their evaporation. Such H2O![]() and H2O
and H2O![]() desorption dynamics indeed has been predicted, 44,58,65 but to the best of our knowledge, Figure 3 for the first time displays its signature.
desorption dynamics indeed has been predicted, 44,58,65 but to the best of our knowledge, Figure 3 for the first time displays its signature.
iii. As to fingerprints of ![]() in the spectra of the solid residue, the spectra we reported in Reference 25 and some not yet published data of ours, likely contain such fingerprints in the ~1700 – 700 cm-1 range. In this range the spectra exhibit numerous peaks ascribable to bending and librations of H2O. Spectral data on ferroelectric-ordered H2O are scarce and pertain to ice. Still it was observed that transitions from ice Ih to the ferroelectric ordered ice XI are mainly reflected in librations of H2O.80 Therefore computations of spectral features and their comparison with our residue’s spectral data are called for.
in the spectra of the solid residue, the spectra we reported in Reference 25 and some not yet published data of ours, likely contain such fingerprints in the ~1700 – 700 cm-1 range. In this range the spectra exhibit numerous peaks ascribable to bending and librations of H2O. Spectral data on ferroelectric-ordered H2O are scarce and pertain to ice. Still it was observed that transitions from ice Ih to the ferroelectric ordered ice XI are mainly reflected in librations of H2O.80 Therefore computations of spectral features and their comparison with our residue’s spectral data are called for.
With the previous sections’ analyzes of our experimental data alluding that the solid residue’s H2O are ferroelectric ordered, experiments employing customary techniques for studying such orderings are called for, e.g., X-ray, NMR, ESR and Mössbauer spectroscopy.
Evidence for ![]() and
and ![]() dispersed in the INW liquid
dispersed in the INW liquid
i. UV-vis absorption spectra of INW have features similar to those of EZ water (see Table 1 line 1) and those of serial diluted vigorous shaken aqueous solutions.20,25,73 For EZ water and these serial diluted solutions, these features were ascribed to the electronic clouds of the H2O constituting ![]() .33,73
.33,73
ii. Long-range dipole correlations in INW, due to H2O aggregates, were observed in our group by Light Scattering.25 Our Fluorescence microscopy data evidence that these are elongated irregular shaped aggregates. We did not observe such aggregates in the control (Milli-Q water). Details of the Fluorescence microscopy technique we employed are reported in our Reference 25. To visualize the aggregates, a 1% in weight of polystyrene latex beads solution was dispersed in a 1 ml INW sample and in the control, i.e., 1 ml of Milli-Q water. The beads of carboxylate-modified polystyrene had a size of 200 nm and each particle carried green fluorescent probes. The beads emit bright, high contrast colors when illuminated by 465 nm light. With the resulting images clearly exhibiting the structures present in INW, we reprint one in Figure 5. From the sizes of the observed aggregates we infer that these are ![]() , which extend typically 10-5 – 10-4 m.52
, which extend typically 10-5 – 10-4 m.52 ![]() are much smaller — their diameter is ~10-7 m.58
are much smaller — their diameter is ~10-7 m.58
iii. Our atomic force microscopy (AFM) data provides additional evidence for the previous paragraph’s inference. Sediment of 5 INW drops, evaporated under ambient conditions on a mica substrate, contain ~10-5 elongated particles with 4.03×10⁻⁷ m maximum height.25 Purity of the substrate was guaranteed by careful cleavage. AFM of sediment of evaporated drops of the control, pure Milli-Q water kept in contact for a prolonged period (days) with plastic Petri capsules, does not reveal nano-particles.25 The asymmetry between the length and height of the aggregates, distinguishable by AFM, hints these are ![]() with their dipoles aligned parallel to the substrate. For quasi-two dimensional polar fluids, which is a reasonable model for a slab of sediment composed of FED, such alignment indeed has been predicted.42 The height of 4.03×10⁻⁷ m will be discussed further on.
with their dipoles aligned parallel to the substrate. For quasi-two dimensional polar fluids, which is a reasonable model for a slab of sediment composed of FED, such alignment indeed has been predicted.42 The height of 4.03×10⁻⁷ m will be discussed further on.
iv. The electric conductivity (χ) data of Figures 1-2, Tables 2-3 and References 24-26 also point to presence of ![]() :
:
(a) The electric conductivity of INW (χINW) is significantly larger (up to about three orders of magnitude) than that of Milli-Q water. χINW correlates with aggregates size.25 The correlation conforms to Reference 53 Sec. 3.2.4 findings, showing: for an aqueous system, the degree of ferroelectric ordering [expressed by ![]() in the abovementioned Equation 4] is proportional to its χ. It reflects collisions among H2OR, contributing to electrical resistance — once
in the abovementioned Equation 4] is proportional to its χ. It reflects collisions among H2OR, contributing to electrical resistance — once ![]() form, the number of H2OR decreases and χ grows. Thus discrepancies between χINW and the conductivity of Milli-Q water are at least partially attributable to differences in the number of their H2OR. However, log χINW is also correlated with the pH of INW (pHINW). The correlations imply that the discrepancies also are due to altered hydronium (H3O+) or hydroxyl (OH–) ions concentrations, an issue which we will discuss further on.
form, the number of H2OR decreases and χ grows. Thus discrepancies between χINW and the conductivity of Milli-Q water are at least partially attributable to differences in the number of their H2OR. However, log χINW is also correlated with the pH of INW (pHINW). The correlations imply that the discrepancies also are due to altered hydronium (H3O+) or hydroxyl (OH–) ions concentrations, an issue which we will discuss further on.

Figure 5a: Fluorescent microscope picture of polystyrene spheres dispersed in INW. 1 μm = 8.26 pixels. Irregular shaped structures are observable in water, i.e., 10-5 m sized structures, on which the marked polystyrene spheres appear to be clustered.

Figure 5b: Fluorescent microscope picture of the control: polystyrene spheres dispersed in Milli-Q water. 1 μm = 8.26 pixels.
(b) On filtration of INW through Millipore filters (25, 100, 200 or 450 nm), we found smaller pores lead to lower χINW.24 With the observed linear correlation between aggregate size and χINW,25 these filtrations indicate the filtrate only retains the smaller aggregates. 450 nm sized pores affecting the filtrate’s χINW confirm the above presented inferences pertaining to the presence of ~10-5 m sized ![]() in INW.
in INW.
(c) χINW of INW stored in polyethylene or polypropylene vials alters with macroscopic times expressed in days (τ) — see Figure 1 and Table 3. χINW(τ) may diminish or increase by as much as ~50% during 0<τ<20 days. The conductivity of INW containing a small quantity of Nafion does not statistical significantly vary with τ. The χINW(τ) alterations point to the membrane inducing aggregate formation, but in its absence these are metastable. χINW(τ)’s diminishments result from aggregates’ disintegration. χINW(τ)’s increases are ascribable to percolation and stabilization of ![]() by the vial’s interface. Impacts of the vials’ interfaces on χ have been analyzed in Reference 53 Sec.3.4.3. As to percolation effects:81 once the iterative Nafionization procedure causes a critical number of H2OR to transit to
by the vial’s interface. Impacts of the vials’ interfaces on χ have been analyzed in Reference 53 Sec.3.4.3. As to percolation effects:81 once the iterative Nafionization procedure causes a critical number of H2OR to transit to ![]() and these all connect, most remnant H2OR move in their close vicinity, experiencing their dipoles, resulting in slower intermolecular collisions; the lower thermal aggression either reduces
and these all connect, most remnant H2OR move in their close vicinity, experiencing their dipoles, resulting in slower intermolecular collisions; the lower thermal aggression either reduces ![]() disintegration or even permits enhancement of ferroelectric ordering — the slowing down of intermolecular collisions and the enhanced ferroelectric ordering both lead to χINW(τ) growth. The opposite is expected and indeed observed on lyophilizing INW samples and subsequent refilling with an equal amount of untreated water. During lyophilization,
disintegration or even permits enhancement of ferroelectric ordering — the slowing down of intermolecular collisions and the enhanced ferroelectric ordering both lead to χINW(τ) growth. The opposite is expected and indeed observed on lyophilizing INW samples and subsequent refilling with an equal amount of untreated water. During lyophilization, ![]() get closely packed; the surface area of these closed packed
get closely packed; the surface area of these closed packed ![]() is smaller than that of the long strings of percolating
is smaller than that of the long strings of percolating ![]() in the original INW. Therefore, on adding untreated water to the residue left over after lyophilizing INW, the percentage of H2OR neighboring on the closely packed
in the original INW. Therefore, on adding untreated water to the residue left over after lyophilizing INW, the percentage of H2OR neighboring on the closely packed ![]() is smaller than that neighboring on the percolating strings of
is smaller than that neighboring on the percolating strings of ![]() in the original INW. As a result, in the refilled sample, the percentage of H2OR undergoing the intermolecular collision rate reducing effect induced by interactions with neighboring
in the original INW. As a result, in the refilled sample, the percentage of H2OR undergoing the intermolecular collision rate reducing effect induced by interactions with neighboring ![]() is smaller than that one in the original INW, i.e., in the refilled sample the intermolecular collision rate of H2OR is higher and hence χINW lower compared to that of the original INW. Computer simulations are called for to quantitatively delineate the relative effects of
is smaller than that one in the original INW, i.e., in the refilled sample the intermolecular collision rate of H2OR is higher and hence χINW lower compared to that of the original INW. Computer simulations are called for to quantitatively delineate the relative effects of ![]() disintegration, percolation and vial interfaces on χINW(τ).
disintegration, percolation and vial interfaces on χINW(τ).
v. The measured macroscopic timescale (days) for reduction of INW’s H2O aggregates (see previous paragraph), which is of the same order as EZ water stabilization,3 also points to these aggregates being ![]() . For estimating
. For estimating ![]() disintegration time, we recall that Equation 4 expresses that rotational population inversion underlies their formation. With the number of H2O comprising a 10-5 – 10-4 m sized
disintegration time, we recall that Equation 4 expresses that rotational population inversion underlies their formation. With the number of H2O comprising a 10-5 – 10-4 m sized ![]() of the order of 1015 – 1017 and rotational de-excitation energies of H2O in liquids of the order of 1011 – 1012 Hz, the uncertainty principle implies the disintegration time is of the order of minutes or days, indeed conforming to its measured value.
of the order of 1015 – 1017 and rotational de-excitation energies of H2O in liquids of the order of 1011 – 1012 Hz, the uncertainty principle implies the disintegration time is of the order of minutes or days, indeed conforming to its measured value.
Evidence for ![]() ⟨supra-
⟨supra-![]() ⟩ dispersed in the INW liquid
⟩ dispersed in the INW liquid
Searching for ![]() ⟨supra-
⟨supra-![]() ⟩ fingerprints in INW data seems worthwhile. According to our INW model, the clumps of ruptured EZ water are dispersed in INW. Del Giudice et al. conjectured EZ water comprises
⟩ fingerprints in INW data seems worthwhile. According to our INW model, the clumps of ruptured EZ water are dispersed in INW. Del Giudice et al. conjectured EZ water comprises ![]() ⟨supra-
⟨supra-![]() ⟩, but only for some EZ water features they showed these are due to these aggregates.34,35 Accordingly, before looking for signs of
⟩, but only for some EZ water features they showed these are due to these aggregates.34,35 Accordingly, before looking for signs of ![]() ⟨supra-
⟨supra-![]() ⟩ in INW, we analyze additional experimental data expounding their presence in EZ water.
⟩ in INW, we analyze additional experimental data expounding their presence in EZ water.
Experimental evidence EZ water comprises ![]() ⟨supra-
⟨supra-![]() ⟩
⟩
i. On EZ water formation, microspheres, medium and large molecules are excluded in the same manner as for advancing ice.14,82 As to small molecules, e.g., HSO–3 released by Nafion, their concentration in room temperature EZ water is at most a few µM,5 just as is observed for ice.83 This ice-like dynamical ordering of the viscous liquid EZ water is typical for stabilization of ![]() ,
,![]() and their agglomeration into
and their agglomeration into ![]() ⟨supra-
⟨supra-![]() ⟩. Non-H2O particles cannot locate within
⟩. Non-H2O particles cannot locate within ![]() , because these alter H2O
, because these alter H2O![]() electronic states. As a result, on
electronic states. As a result, on ![]() stabilization non-H2O get expelled.34,58,65 Few non-H2O particles can locate within
stabilization non-H2O get expelled.34,58,65 Few non-H2O particles can locate within ![]() , because these only perturbatively affect
, because these only perturbatively affect ![]() rotational states, but large numbers cause their disintegration. Thus stabilization of
rotational states, but large numbers cause their disintegration. Thus stabilization of ![]() also expels most non-H2O.39,43,52,73
also expels most non-H2O.39,43,52,73
ii. The viscosity of EZ water is about ten-fold higher than that one of bulk water.3 This signifies that the fraction of ordered H2O in EZ water is larger than in bulk water — a phenomenon attributable to stabilization of ![]() and
and ![]() by the interface.33-35
by the interface.33-35
iii. NMR shows that spin-lattice relaxation times in EZ water are shorter than in bulk water. This implies H2O motion in EZ water is more restricted than that one in bulk water due to different orderings.3,16 This phenomenon is compatible with stabilization of ![]() and
and ![]() .33,34
.33,34
iv. IR radiation emitted by EZ water is significantly less than that one of its adjacent bulk water. The disparity is ascribable to EZ water’s more stable structure,3 e.g., stabilization of ![]() and
and ![]() . (IR emission is a function of structure and temperature. No significant role of temperature could be identified.3 Sustained temperature gradients over EZ water’s µm – mm spatial regions persisting during the macroscopic timescales of the measurements are unlikely.3)
. (IR emission is a function of structure and temperature. No significant role of temperature could be identified.3 Sustained temperature gradients over EZ water’s µm – mm spatial regions persisting during the macroscopic timescales of the measurements are unlikely.3)
v. Polarizing microscopy shows EZ water is birefringent,5,17 e.g., the radiation pattern adjacent to Nafion is a set of light and dark fringes oriented in parallel to the membrane, revealing anisotropic quasi-crystalline ordering. Anisotropy indeed is a feature of ![]() .43,52 In particular, orientation parallel to the membrane is concordant with
.43,52 In particular, orientation parallel to the membrane is concordant with ![]() properties, as well as the ferroelectric ordering predicted by Density Functional Theory.42,45
properties, as well as the ferroelectric ordering predicted by Density Functional Theory.42,45 ![]() ’s tetrahedrally coordinated but not proton-ordered H2O cannot underlie such orientation ordering.64
’s tetrahedrally coordinated but not proton-ordered H2O cannot underlie such orientation ordering.64
vi. The molecular refraction (γ) of EZ water differs from that one of bulk water, e.g., near Nafion γ is ~30 percent higher.5 We attribute the difference to interfaces stabilizing ![]() . For γ holds γ=(4π/3)ρα. Here α and ρ, respectively, denote H2O’s electronic polarizability and density.5 It has been deduced that ρ of EZ water significantly contributes to the difference.5 We ascribe the high ρ value of EZ water to the proton ordering typifying
. For γ holds γ=(4π/3)ρα. Here α and ρ, respectively, denote H2O’s electronic polarizability and density.5 It has been deduced that ρ of EZ water significantly contributes to the difference.5 We ascribe the high ρ value of EZ water to the proton ordering typifying ![]() . ρ of proton ordered ice is higher than that one of ice Ih or water.84 For the tetragonal proton ordered ice IX, ρ=1.16 g cm-3. Some other proton ordered ice phases have even higher ρ. The high ρ value of EZ water is not attributable to
. ρ of proton ordered ice is higher than that one of ice Ih or water.84 For the tetragonal proton ordered ice IX, ρ=1.16 g cm-3. Some other proton ordered ice phases have even higher ρ. The high ρ value of EZ water is not attributable to ![]() . The density of
. The density of ![]() is 0.92 g cm-3, i.e., it is less than that one of bulk water.33,58 Hence, the experimentally derived high ρ value of EZ water indicates a large percentage of EZ water’s H2O is organized in
is 0.92 g cm-3, i.e., it is less than that one of bulk water.33,58 Hence, the experimentally derived high ρ value of EZ water indicates a large percentage of EZ water’s H2O is organized in ![]() . Enhancement of α due to
. Enhancement of α due to ![]() ’s ferroelectric ordering also contributes to the difference between γ of EZ water and that of bulk water. However, as pointed out in Reference 5, total orientation ordering of H2O would enhance γ only by 13 percent, i.e., altered α alone cannot account for the ~30 percent difference. With γ only negligible changed by ions released by membranes, ions resulting from altered dissociation of H2O or dissolution of the membrane,5 the aforementioned implies ρ of EZ water is at least ~17 percent higher than one of bulk water.
’s ferroelectric ordering also contributes to the difference between γ of EZ water and that of bulk water. However, as pointed out in Reference 5, total orientation ordering of H2O would enhance γ only by 13 percent, i.e., altered α alone cannot account for the ~30 percent difference. With γ only negligible changed by ions released by membranes, ions resulting from altered dissociation of H2O or dissolution of the membrane,5 the aforementioned implies ρ of EZ water is at least ~17 percent higher than one of bulk water.
vii. The diffraction index (n0) of EZ water monotonically decreases with its distance from the interface.6 This feature is attributable to H2O ordering diminishing with this distance.6 It agrees with ![]() and
and ![]() constituting EZ water. Their ordering weakens with this distance.34
constituting EZ water. Their ordering weakens with this distance.34
viii. pH phenomena observed during EZ formation (see Table 1, line 3) and the phenomenon of EZ water being electrically charged with respect to its bordering bulk water are readily explained by stabilization of ![]() and
and ![]() ensembles, as pointed out by Del Giudice et al.33-35 The electromagnetic field resulting from plasma oscillations of charged particles on the surfaces of membranes or metals interacts with EZ water’s
ensembles, as pointed out by Del Giudice et al.33-35 The electromagnetic field resulting from plasma oscillations of charged particles on the surfaces of membranes or metals interacts with EZ water’s ![]() ,
, ![]() ,
,![]() ⟨supra-
⟨supra-![]() ⟩, and the plasma oscillations of its ions. These interactions lead to enhanced dissociation of H2O or surface groups. For negatively charged surfaces this field resonates with the oscillating negatively charged solvated particles. The positive charged solvated particles resonate at a different frequency and consequently get expelled and accumulate outside the EZ, i.e., in bulk water bordering on the EZ. The opposite occurs for a positively charged surface. Its electromagnetic field resonates with that one of positively charged solvated particles, while negatively charged solvated particles get expelled — details of these explanations are presented in Reference 34.
⟩, and the plasma oscillations of its ions. These interactions lead to enhanced dissociation of H2O or surface groups. For negatively charged surfaces this field resonates with the oscillating negatively charged solvated particles. The positive charged solvated particles resonate at a different frequency and consequently get expelled and accumulate outside the EZ, i.e., in bulk water bordering on the EZ. The opposite occurs for a positively charged surface. Its electromagnetic field resonates with that one of positively charged solvated particles, while negatively charged solvated particles get expelled — details of these explanations are presented in Reference 34.
ix. For the phenomenon of EZ water being electrically charged with respect to its bordering bulk water, we offer an explanation complementing the one cited in the previous paragraph. For an H2O ensemble with finite dimensions, ferroelectric ordering implies the addition of an electrostatic term to its potential energy (the 2nd term in Equation 4 of Reference 85 representing the effect of the macroscopic electric field due to the charges at the boundary). This term’s contribution to the potential energy is about hundred times larger than the energetic differences of various hydrogen bond configurations.85 Alike charged ions, dispersed within the ensemble, screen the boundary polarization and reduce this term.85 Hence accumulation of alike charged ions in EZ water and expulsion of opposite charged ones reduce polarization at the EZ – bulk water boundary and stabilize ![]() . Apparently, the energy gained from
. Apparently, the energy gained from ![]() stabilization is higher than the dissociation energy of H2O
stabilization is higher than the dissociation energy of H2O![]() and H2O
and H2O![]() , or surface groups required for generating ions capable of screening the boundary polarization. Calculation of the energetic changes involved in the mechanisms discussed in this paragraph is outside the scope of this paper, but promises verification of our aforementioned explanation.
, or surface groups required for generating ions capable of screening the boundary polarization. Calculation of the energetic changes involved in the mechanisms discussed in this paragraph is outside the scope of this paper, but promises verification of our aforementioned explanation.
Our explanation also elucidates the phenomena triggered by addition of buffers. Buffers were observed to enhance H3O+ or OH– concentration within EZ water, sharpen the EZ – bulk water boundary, widen EZ (up to 40 percent); boost EZ water’s robustness, i.e., reduce the impact of thermal aggression by bulk water.14 All these phenomena may result from enhanced screening of boundary polarization concurrent with buffer induced higher H3O+ or OH– concentrations.
x. UV-vis or IR irradiation of interfacial water widen the width of its EZ.13 Up to 300 percent widening has been observed. The widening is a function of irradiation time and intensity. The widening follows closely the spectral sensitivity of electromagnetic absorption by water; irradiation at 3.1 µm induces the most profound widening. We attribute these irradiation effects to:
(a) Enhancement of H2O dissociation by UV-vis or IR radiation — a phenomenon reported in References 86 and 87. As discussed in the previous paragraph, higher H3O+ or OH– concentrations contribute to stabilization of ![]() .
.
(b) The photonic crystal-like nature of ![]() ⟨supra-
⟨supra-![]() ⟩. Bunkin et al. were the first to point out photonic that crystals comprising EZ water may explain the impact of irradiation on water near Nafion.5 They assumed molecular surface groups present on the Nafion membrane and their neighboring H2O form crystals, wherein a standing optical wave resides: a wave with infinite phase velocity, zero group velocity, comprised of photons captured by the crystal, a photon density which grows during irradiation according to the Bose-Einstein law. While Nafion and numerous other hydrophilic membranes contain molecular surface groups, it is hard to envision their presence on reactive metal surfaces, adjacent to which EZ water was observed too.9 So, we conjecture that the standing waves are superpositions of the U
⟩. Bunkin et al. were the first to point out photonic that crystals comprising EZ water may explain the impact of irradiation on water near Nafion.5 They assumed molecular surface groups present on the Nafion membrane and their neighboring H2O form crystals, wherein a standing optical wave resides: a wave with infinite phase velocity, zero group velocity, comprised of photons captured by the crystal, a photon density which grows during irradiation according to the Bose-Einstein law. While Nafion and numerous other hydrophilic membranes contain molecular surface groups, it is hard to envision their presence on reactive metal surfaces, adjacent to which EZ water was observed too.9 So, we conjecture that the standing waves are superpositions of the U![]() and the UFED, i.e., the electromagnetic fields condensed, respectively, within
and the UFED, i.e., the electromagnetic fields condensed, respectively, within ![]() and within the FED constituting
and within the FED constituting ![]() , with the evanescent tails of U
, with the evanescent tails of U![]() overlapping within supra-
overlapping within supra-![]() (see the Theory section). Superpositions of the UFED and the U
(see the Theory section). Superpositions of the UFED and the U![]() likely can account for interfacial water’s complex interactions with UV-vis and IR radiation. UFED and U
likely can account for interfacial water’s complex interactions with UV-vis and IR radiation. UFED and U![]() characteristics have been derived from first principles,43,52,58 but it is outside the scope of this paper to show how these explain such interactions.
characteristics have been derived from first principles,43,52,58 but it is outside the scope of this paper to show how these explain such interactions.
xi. In polar liquids other than water, EZ forms too.15 In methanol, ethanol, isopropanol, acetic acid, D2O and dimethyl sulfoxide, a negatively charged EZ forms adjacent to Nafion membranes.15 Its width is smaller than that of EZ water and grows in response to IR irradiation.15 For polar liquids, stabilization of AGFED (the analogues of ![]() ) near interfaces has been derived from first principles.43,52 As to domains analogous to
) near interfaces has been derived from first principles.43,52 As to domains analogous to ![]() in non-aqueous liquids, theory has not yet delineated their characteristics and to the best of our knowledge experiments have not yet revealed such domains. Since at ambient conditions the diameter of AGFED is of the order of the width of the EZ, while the diameter of supra-
in non-aqueous liquids, theory has not yet delineated their characteristics and to the best of our knowledge experiments have not yet revealed such domains. Since at ambient conditions the diameter of AGFED is of the order of the width of the EZ, while the diameter of supra-![]() is only about 10-7 m (i.e., each supra-
is only about 10-7 m (i.e., each supra-![]() contains only a few
contains only a few ![]() ),73 the stabilization of AGFED by interfaces seems to be a central mechanism underlying EZ formation in polar liquids in general and water in particular.
),73 the stabilization of AGFED by interfaces seems to be a central mechanism underlying EZ formation in polar liquids in general and water in particular.
xii. Characteristics of rotational electro-hydro-dynamical motions (REHDM) in thin (few µm) polar liquid films confirm the last paragraph’s conclusions.56 Experiments exposed that such motions could be induced by applying two crossed electric fields to a polar liquid film suspended by a two-dimensional frame, i.e., REHDM were observed in a quasi two-dimensional electrolysis cell, located in an external in-plane electric field which crosses the mean electrolysis current density.88 REHDM can be induced even if the polar liquid does not contain hydrogen bonds and/or their conductivity is low. For example, REHDM are inducible in water, aniline, anisole, chlorobenzene and diethyleoxalate but not in non-polar liquids like 1-Dodecene.88 Threshold values of the applied electric fields required for inducing the motions are in the same order of magnitudes for polar liquids with different electrical conductivity, viscosity and/or density.88 The experimentalists pointed out their empirical results indicate the intrinsic polarity of the liquid molecules plays a major role in the rotation mechanism.88 One of us showed that stabilization of FED by the liquid-air interfaces of the µm thin suspended polar liquid films and their agglomeration into AGFED induced by an external in-plane electric field underlie the observed REHDM.11,55 Computed REHDM of polar liquid molecules organized in AGFED predict threshold values for the applied electric fields which are in quantitative agreement with the measured ones. 11,55 Computed linear and angular velocities of REHDM qualitatively conform to measured ones.11,55
The distinctive impact of the EZ, induced by the hydrophilic boundary of the two-dimensional frame suspending the film, was recently computed. The numerous results are detailed in another publication.56 A finding relevant to our topic is that enhanced stabilization of AGFED by the hydrophilic two-dimensional frame affects REHDM. For example, differences between the density, viscosity and polarization of the EZ and that of the rest of the film affect the linear velocity and direction of REHDM. Depending on the EZ parameters, up to a few seconds after application of the electric fields, within the EZ adjacent to the two-dimensional frame the direction of the REHDM is opposite to that of the remainder of the film, as expounded by Figure 6. This is the typical characteristic of the Kelvin-Helmholtz instability. Such dependence of the direction and linear velocity of the REHDM on the parameters of the EZ, e.g., its width, density, viscosity and degree of ferroelectric ordering, implies it is possible to estimate the enhancement in stabilization of AGFED by the hydrophilic two-dimensional frame compared to that of the remainder of the film. Future research directed at computing-extracting such enhancements promises quantification of polarization in EZ.
 after application of the electric fields : t = 10-4 s, 10-3 s, 10-2 s, 10-1 s, 100 s. R=310 µm, dEZ=30 µm and dTL=30 µm, respectively, represent the radius of rotating liquid film, the thickness of the EZ and the thickness of the transition layer between the EZ and the remainder of the water film.")
Figure 6: Profiles of the linear velocity at different times (t) after application of the electric fields : t = 10-4 s, 10-3 s, 10-2 s, 10-1 s, 100 s. R=310 µm, dEZ=30 µm and dTL=30 µm, respectively, represent the radius of rotating liquid film, the thickness of the EZ and the thickness of the transition layer between the EZ and the remainder of the water film.
Experimental evidence INW contain ![]() ⟨supra-
⟨supra-![]() ⟩ —
⟩ —
i. pH phenomena typifying INW are commensurable with it containing ![]() ⟨supra-
⟨supra-![]() ⟩, or more specifically it containing clumps of EZ water composed of
⟩, or more specifically it containing clumps of EZ water composed of ![]() ⟨supra-
⟨supra-![]() ⟩, because:
⟩, because:
(a) Iterative Nafionization of pure Milli-Q water with pH=6 significantly enhances its acidity, e.g., pHINW reach values as low as 3.24-26 Such values are comparable to that of the pH in the strip of bulk water bordering on EZ water (see Table 1, line 3).3,13
(b) pH-metric titrations of INW with NaOH as titrant are similar to those for neutralizing a strong acid with a strong base, and the same holds for conductometric and calorimetric titrations.26
(c) The dynamics and thermo-dynamical aspects of the titrants’ OH– forming complexes with the H2O aggregates [reflected in INW’s pH, electric conductivity and heat of mixing with NaOH (![]() ) data] are commensurate with
) data] are commensurate with ![]() ⟨supra-
⟨supra-![]() ⟩ presence, as apparent from the discussions in Reference 26 and Reference 53 Sec. 3.2.
⟩ presence, as apparent from the discussions in Reference 26 and Reference 53 Sec. 3.2.
pHINW values are linearly correlated with the logarithm of INW’s electric conductivity and heat of mixing with NaOH, i.e., log χINW and log ![]() .24,89 The correlations indicate that a single cause underlie these physicochemical variables of INW. The correlations are ascribable to the following processes: Firstly, enhanced dissociation of H2O (i.e., rise of the dissociation constant of water above 1×10-14) when Nafion is immersed in bulk water and EZ water forms, with the OH– dispersing within the EZ and H3O+ accumulating in its bordering bulk water. Plasma oscillations and/or boundary polarization screening, requiring such ion distributions [as noted in the previous sub-section’s paragraphs (viii) and (ix)] alter the system’s energy. Secondly, agitations rupturing the negatively charged EZ from the membrane and dispersing its clumps and its neighboring H3O+ in bulk water render it a strong acid. The negatively charged clumps of EZ water constitute the counter-ions of the H3O+. The concentration of H2O aggregates in INW is ~10-4 M.26
.24,89 The correlations indicate that a single cause underlie these physicochemical variables of INW. The correlations are ascribable to the following processes: Firstly, enhanced dissociation of H2O (i.e., rise of the dissociation constant of water above 1×10-14) when Nafion is immersed in bulk water and EZ water forms, with the OH– dispersing within the EZ and H3O+ accumulating in its bordering bulk water. Plasma oscillations and/or boundary polarization screening, requiring such ion distributions [as noted in the previous sub-section’s paragraphs (viii) and (ix)] alter the system’s energy. Secondly, agitations rupturing the negatively charged EZ from the membrane and dispersing its clumps and its neighboring H3O+ in bulk water render it a strong acid. The negatively charged clumps of EZ water constitute the counter-ions of the H3O+. The concentration of H2O aggregates in INW is ~10-4 M.26
ii. The similar timescales for INW’s aggregates’ reduction and EZ water’s stabilization (see Table 1 line 5) point to these aggregates being clumps of EZ water with their ![]() ⟨supra-
⟨supra-![]() ⟩ intact.
⟩ intact.
iii. INW’s and EZ water’s UV-vis absorption spectra closely resemble each other (see Table 1 line 1). Our above presented conjecture that the distinctive features of UV-vis absorption by EZ water are attributable to the photonic crystalline nature of ![]() ⟨supra-
⟨supra-![]() ⟩ implies that the resemblance is due to presence of such
⟩ implies that the resemblance is due to presence of such ![]() and
and ![]() ensembles in INW, i.e., in its dispersed clumps of EZ water. With the high sensitivity of spectral data to superposition phenomena, we expect comparison of INW’s and EZ water’s UV-vis absorption to shed light on the characteristics of UFED and U
ensembles in INW, i.e., in its dispersed clumps of EZ water. With the high sensitivity of spectral data to superposition phenomena, we expect comparison of INW’s and EZ water’s UV-vis absorption to shed light on the characteristics of UFED and U![]() condensed in
condensed in ![]() ⟨supra-
⟨supra-![]() ⟩.
⟩.
iv. For the ~10-5 m elongated particles with 4.03×10⁻⁷ m maximum height in sediment of evaporated INW drops observed by atomic force microscopy,25 the asymmetry between their length and height hints these are ![]() with their dipole moments aligned parallel to the substrate. The height of 4.03×10⁻⁷ m suggests that the thickness of the
with their dipole moments aligned parallel to the substrate. The height of 4.03×10⁻⁷ m suggests that the thickness of the ![]() is determined by their supra-
is determined by their supra-![]() diameters, i.e., typically three to four layers of
diameters, i.e., typically three to four layers of ![]() constitute the
constitute the ![]() ⟨supra-
⟨supra-![]() ⟩. Indeed the diameters of supra-
⟩. Indeed the diameters of supra-![]() in
in ![]() ⟨supra-
⟨supra-![]() ⟩ are typically about 2×10⁻⁷ – 4×10⁻⁷ m.73
⟩ are typically about 2×10⁻⁷ – 4×10⁻⁷ m.73
v. Table 2 shows that the density of INW (ρINW) is larger than that one of water (ρwater). Figure 2 shows that their differences (ρINW – ρwater) are linearly correlated with χINW. Also INW’s H2O aggregates’ sizes are linearly correlated with χINW.25 The density of EZ water is at least ~17 percent higher than of bulk water.5 All these facts indicate ρINW values are attributable to INW containing clumps of EZ water. ρINW >ρwater points to the clumps’ H2O mainly being organized in ![]() , i.e., contain relatively fewer
, i.e., contain relatively fewer ![]() . This is because the density of some types of ferroelectric ordered H2O is much higher (~16 percent or more) than that of water, while the density of
. This is because the density of some types of ferroelectric ordered H2O is much higher (~16 percent or more) than that of water, while the density of ![]() is 0.92 g cm-3, i.e., less than that one of water.58
is 0.92 g cm-3, i.e., less than that one of water.58
vi. logχINW’s linear correlation with log![]() and with pHINW signifies a scale free self-similar phenomenon.89 It is attributable to perturbations of the H2O dynamics triggered by their iterated interactions with the Nafion membrane. The perturbations cause a breakdown of the symmetry of the quantum molecular dynamical model. The perturbed dynamical interactions between H2O and the radiative electromagnetic fields (due to the instabilities discussed in the Theory section) trigger two types of phase transitions leading to
and with pHINW signifies a scale free self-similar phenomenon.89 It is attributable to perturbations of the H2O dynamics triggered by their iterated interactions with the Nafion membrane. The perturbations cause a breakdown of the symmetry of the quantum molecular dynamical model. The perturbed dynamical interactions between H2O and the radiative electromagnetic fields (due to the instabilities discussed in the Theory section) trigger two types of phase transitions leading to ![]() ⟨supra-
⟨supra-![]() ⟩ formation.
⟩ formation.
Conclusions
This paper reports new experimental physicochemical data on water perturbed by repeated contact with Nafion membranes, i.e., so called iterative Nafionized water (INW). It also presents new data on the solid residue left over after lyophilizing INW, i.e., it presents the thermogravimetric graph of the solid residue. Our analyses of this graph evidence: the solid residue is composed of two types of H2O orderings; these orderings are attributable to two kinds of phase transitions triggered by perturbing water with a Nafion membrane. Experimental data published in several of our previous publications provided physicochemical characterizations of INW and of its solid residue left over after its lyophilization. However, these did not facilitate discerning the two different types of H2O orderings. Based on the information on the solid residue’s characteristics exposed by our thermogravimetric graph, we succeeded to provide a model for INW. Thanks to the model, we could consistently explain INW’s and the solid residue’s measured characteristics, including the density and electric conductivity data first reported in this study.
Our analyses show electrodynamic interactions play a role in the µm sized H2O orderings present in INW and in the solid residue left over after lyophilizing INW. Our measured properties of INW are commensurate with those ones predicted by electrodyna-mic theories of water. According to the classical and quantum electrodynamic theories for polar liquids (e.g. water), interfaces may induce a phase transition resulting in ferroelectric orderings, e.g., formation of 10-5 – 10-4 m sized domains composed of H2O. We denoted these domains ![]() . Quantum electrodynamic theory also shows that due to long range dispersive interactions, near interfaces,
. Quantum electrodynamic theory also shows that due to long range dispersive interactions, near interfaces, ![]() (~10-7 m sized domains wherein H2O transit between two electronic states) are stabilized and assemble into supra-
(~10-7 m sized domains wherein H2O transit between two electronic states) are stabilized and assemble into supra-![]() . Quantum physics shows superposition enables the 10-5 – 10-4 m sized
. Quantum physics shows superposition enables the 10-5 – 10-4 m sized ![]() to contain numerous ~10-7 m sized
to contain numerous ~10-7 m sized ![]() . All of our measured widely varying physicochemical characteristics of INW are concurrent with its containing
. All of our measured widely varying physicochemical characteristics of INW are concurrent with its containing ![]() and
and ![]() ensembles. The same is true for the solid residue left over after lyophilizing INW. We emphasize, to the best of our knowledge, that our thermogravimetric graph provides the first experimental signs of the critical transition temperatures typifying
ensembles. The same is true for the solid residue left over after lyophilizing INW. We emphasize, to the best of our knowledge, that our thermogravimetric graph provides the first experimental signs of the critical transition temperatures typifying ![]() and
and ![]() formation. These critical temperatures values were theoretically derived from first principles in previous publications, respectively, in 1995 and 2005.58,39
formation. These critical temperatures values were theoretically derived from first principles in previous publications, respectively, in 1995 and 2005.58,39
Our analyses show that INW’s H2O aggregates have numerous characteristics similar to those of exclusion zone (EZ) water, i.e., the zone adjacent to hydrophilic membranes like Nafion or to reactive metals. Therefore, we extended previous analyses of EZ water, in particular those ones of Del Giudice et al. who showed some properties of EZ water to be ascribable to ![]() and
and ![]() ensembles.33-35 To the best of our ability, we screened the literature for reported EZ water properties as well as presented some recently derived and not yet published ones. We showed that all of these properties, at least qualitatively, can be explained by
ensembles.33-35 To the best of our ability, we screened the literature for reported EZ water properties as well as presented some recently derived and not yet published ones. We showed that all of these properties, at least qualitatively, can be explained by ![]() and
and ![]() comprising EZ water. We concluded that stabilization of AGFED by interfaces seems to be a central mechanism underlying EZ formation, because at ambient conditions the diameter of AGFED is of the order of the width of the EZ, while the diameter of supra-
comprising EZ water. We concluded that stabilization of AGFED by interfaces seems to be a central mechanism underlying EZ formation, because at ambient conditions the diameter of AGFED is of the order of the width of the EZ, while the diameter of supra-![]() is only about 10-7 m (i.e., each supra-
is only about 10-7 m (i.e., each supra-![]() contains only a few
contains only a few ![]() ). Based on the similarities between INW’s aggregates’ and EZ water’s H2O ordering exposed by us, we conclude that iterative Nafionization of water, i.e., repeated perturbation of water by iteratively immersing a Nafion membrane and agitating the liquid, results in EZ water molecular ordering being “impressed” in bulk water: on immersing Nafion, EZ forms; the agitations rupture EZ water clumps from the membrane and disperse these in neighboring bulk water; iteration of the re-immersion, agitations, membrane-removal-drying cycle enhances the concentration of the clumps and these become observable. In particular, our conclusion is supported by:
). Based on the similarities between INW’s aggregates’ and EZ water’s H2O ordering exposed by us, we conclude that iterative Nafionization of water, i.e., repeated perturbation of water by iteratively immersing a Nafion membrane and agitating the liquid, results in EZ water molecular ordering being “impressed” in bulk water: on immersing Nafion, EZ forms; the agitations rupture EZ water clumps from the membrane and disperse these in neighboring bulk water; iteration of the re-immersion, agitations, membrane-removal-drying cycle enhances the concentration of the clumps and these become observable. In particular, our conclusion is supported by:
• the close resemblance of INW’s and EZ water’s UV-vis spectral features;
• the peculiar pH phenomena typifying INW and EZ water;
• the macroscopic timescales typifying the reduction of INW’s aggregates and stabilization of EZ water, both of the order of days;
• the density of INW and EZ water both being significantly larger than that one of unperturbed water.
An important implication of our study is that investigations of EZ water, which hitherto were carried out by measuring its physical variables, can be complemented by observing its ruptured clumps dispersed in INW. Another noteworthy implication is that water, which was in contact with hydrophilic surfaces (like biological tissues) or reactive metals for prolonged periods and subsequently got perturbed (for example by air flows or pumping), may contain H2O aggregates and enhanced H3O+ or OH– concentrations. These aggregates and ions may affect biological reactions or other processes (corrosion, catalyses). Indeed in our previous studies of iteratively filtered water we observed H2O aggregates.25,53
As to future research, in the Discussion section we already pointed out the computations and measurements required for quantitatively verifying that INW and EZ water both contain ![]() ,
,![]() and
and ![]() ⟨supra-
⟨supra-![]() ⟩. We also deem it is desirable to expound upon additional similarities between these liquids’ physical characteristics. To this purpose, we suggest to investigate pH changes induced by positively charged surfaces. This study’s findings predict iterative immersing of positively charged membranes in water will lead to enhancement of OH- concentrations, just as observed for bulk water bordering on the EZ of such membranes. Another important research direction is the delineation of differences between the impacts of sheets with hydrophilic surfaces versus those of hydrophobic ones on adjacent water. With formation of an EZ adjacent to the former and hitherto not observed for the latter, such a study promises to provide additional insight into H2O ordering within EZ water.
⟩. We also deem it is desirable to expound upon additional similarities between these liquids’ physical characteristics. To this purpose, we suggest to investigate pH changes induced by positively charged surfaces. This study’s findings predict iterative immersing of positively charged membranes in water will lead to enhancement of OH- concentrations, just as observed for bulk water bordering on the EZ of such membranes. Another important research direction is the delineation of differences between the impacts of sheets with hydrophilic surfaces versus those of hydrophobic ones on adjacent water. With formation of an EZ adjacent to the former and hitherto not observed for the latter, such a study promises to provide additional insight into H2O ordering within EZ water.
Dedication
We dedicate this paper to the memory of Prof. Emilio Del Giudice, who passed away on January 31, 2014. He was one of the developers of the quantum electrodynamic model of aqueous systems, which we employed in this paper. He extensively used it to explain numerous (surprising) phenomena, with major implications for physics, chemistry, biology, medicine, agriculture and technology — including those ones of EZ water discussed in this paper. With much appreciation, we remember this brilliant, warm, caring, humoristic colleague and friend, who worked hard to benefit humanity.
Acknowledgements
We thank Prof. Francesco Branda and Dr. Brigida Silvestri, Dip. Ingegneria Chimica dei Materiali e della Produzione Industriale Università “Federico II” — Napoli, for the TGA measurements. Zhong-Qiang Liu thanks the support of the National Natural Science Foundation of China (Grant No. 11302118). Tamar Yinnon expresses her appreciation for Prof. A. M. Yinnon’s continuous support and encouragement.

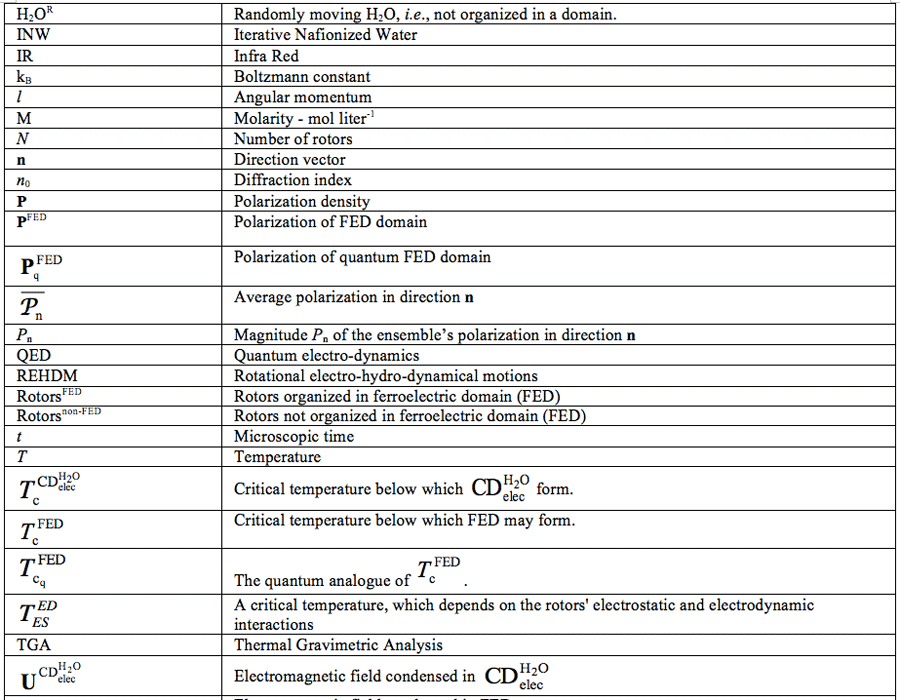
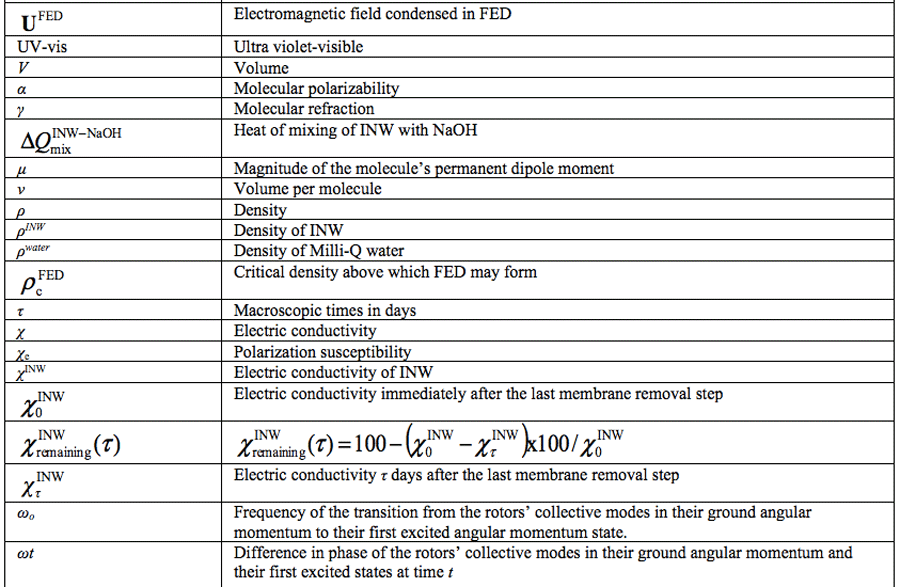
Discussion with Reviewers
Reviewer 1: The authors talk about the ordering of the INW structure and of two different types of phase transitions. Could they illustrate this point better, relating it to the Nafion contact effects?
Yinnon T, Elia V, Napoli E, Germano R, and Liu Z-Q: The structural and thermodynamic properties of molecular ensembles due to quantum fluctuations has been an active research field ever since the advent of quantum physics. Quantum fluctuations are non-thermal — these persist when temperature vanishes. In 1930 London showed these underlie the intermolecular dispersion force, which is a component of the van der Waals force. In 1948 Casimir and Polder derived the expression for the dispersion force underlying intermolecular interactions over distances of the order or larger than the molecules’ characteristic absorption wavelengths. In 1961 Dzyaloshinskii, Lifshitz and Pitaevskii, by employing quantum field theory, succeeded in deriving the contribution of dispersion to thermodynamic quantities. (Quantum field theory is the most accurate physics theory.) This enabled them to expound issues like the interaction energy between molecules in a liquid and phenomena pertaining to a thin liquid film on the surface of a solid body. They showed that the characteristics of the materials determine whether the dispersion force is attractive or repulsive. Subsequent research showed that dispersion forces are responsible for many adhesion and coalescence processes in biological and colloidal systems. As to the influence of dispersion forces on the structure of water and other polar liquids, an in-depth quantum field theoretical assessment only became feasible when Del Giudice, Preparata and Vitiello in 1988 resolved various issues. They succeeded in developing a non-perturbative (variational) quantum field theory model based on the Feynman path integral method. Their quantum electro-dynamic (QED) model enabled investigations of phase transitions. Based on their findings, in 2010, 2013 and 2014, Del Giudice, Tedeschi, Vitiello, Voeikov and Spinetti studied the structure of water close to surfaces and provided a model for EZ water. The relevance of this historical overview for providing the general scientist with a glimpse of the theoretical underpinnings of EZ water was pointed out by Dr. A. De Ninno on the tenth annual Water Conference: Conference on the Physics, Chemistry and Biology of Water (Bulgaria 2014). We deem this overview also pertinent for appreciating our theoretical and experimental findings for INW. Scientists are well aware that quantum fluctuations influence matter. They are familiar with dispersion forces. However, the significant research findings pertaining to long range interactions in aqueous systems, derived within the context of QED during the last few decades, have not yet widely diffused into the scientific community.
Water in contact with a Nafion membrane, as well as water adjacent to other materials, has thermodynamic properties differing from those of bulk water, as derived by Dzyaloshinskii and co-workers. The immersion of a membrane, for example, perturbs local electric fields, polarization, and Gibbs energy in its adjacent water and causes symmetry breaking. In the presence of an instability, such perturbations may affect phase transitions. Del Giudice, Preparata and Vitiello identified two instabilities in the QED equations describing water. Specifically Del Giudice, Voeikov, Tedeschi, Vitiello, and Spinetti showed that the immersion of a membrane: (a) triggers a ferroelectric phase transition resulting in 10-5 – 10-4 m sized domain formations wherein H2O are ferroelectric ordered (denoted ![]() in our paper); (b) stabilize ~10-7 m sized domains (denoted
in our paper); (b) stabilize ~10-7 m sized domains (denoted ![]() in this paper), wherein dispersive interactions cause the electronic transitions of the H2O to be correlated. H2O may reside in a superposition of the ferroelectric ordered and electronically excited states, i.e., a
in this paper), wherein dispersive interactions cause the electronic transitions of the H2O to be correlated. H2O may reside in a superposition of the ferroelectric ordered and electronically excited states, i.e., a ![]() may contain several
may contain several ![]() . In bulk water,
. In bulk water, ![]() and
and ![]() are meta-stable. The aforementioned implies that by bringing water into contact with Nafion,
are meta-stable. The aforementioned implies that by bringing water into contact with Nafion, ![]() and
and ![]() get stabilized in its adjacent water. On withdrawal of the Nafion, it takes time for this disturbance to fade. The meta-stable domains may persist for days in the bulk of the liquid. Moreover, container walls may stabilize the domains. Thus after removal of the Nafion, the dissipative dynamics of H2O orderings may persist for many months. It is affected by factors like the vial’s surface/volume ratio and ambient conditions.
get stabilized in its adjacent water. On withdrawal of the Nafion, it takes time for this disturbance to fade. The meta-stable domains may persist for days in the bulk of the liquid. Moreover, container walls may stabilize the domains. Thus after removal of the Nafion, the dissipative dynamics of H2O orderings may persist for many months. It is affected by factors like the vial’s surface/volume ratio and ambient conditions.
Reviewer 2: Figure 3 shows a thermogra-vimetric dependence of the solid residue decrease (in percentage terms) versus the temperature. The authors claim this figure has features concurrent with two types of continuous phase transitions. In this figure we discern a segment within the range 100 – 220 ºC, which can be characterized as having two crossovers. The authors associate these two temperatures with critical temperatures. I would like to see some formulas indicating that the thermo-gravimetric dependence contains features of the crossover type, and these crossovers correspond to the continuous phase transition. Does this mean that we deal with the upper and lower critical points, i.e. with a closed binodal? What are the relevant coordinates for the phase plane? If this is a multi-component system, what is the order parameter we can characterize the system with?
Yinnon, Elia, Napoli, Germano, and Liu: Details of the mathematics and graphics pertaining to the phase transition leading to stabilization of ![]() are presented in Reference 58 and those for
are presented in Reference 58 and those for ![]() in References 39, 43 and 52. These show that for a H2O ensemble at pressures of 1 Atm and at temperatures of 0 K, all H2O are ordered in
in References 39, 43 and 52. These show that for a H2O ensemble at pressures of 1 Atm and at temperatures of 0 K, all H2O are ordered in ![]() . On heating the ensemble, H2O desorb from
. On heating the ensemble, H2O desorb from ![]() . These desorbed H2O locate adjacent to the boundaries of
. These desorbed H2O locate adjacent to the boundaries of ![]() — their diffusion in the interstices between
— their diffusion in the interstices between ![]() depends on temperature. The chemical potential determines whether these desorbed H2O stick to the
depends on temperature. The chemical potential determines whether these desorbed H2O stick to the ![]() or escape into the gas-phase. Above the critical temperature of 100 ºC, the desorbed H2O only reside in the gas phase.
or escape into the gas-phase. Above the critical temperature of 100 ºC, the desorbed H2O only reside in the gas phase.
We emphasize that Figure 3 is a decomposition curve of the solid residue (it is not a phase diagram). Its crossover at 100 ºC signifies the critical temperature of the desorbed H2O.![]() only exist at temperatures below the critical temperature
only exist at temperatures below the critical temperature ![]() = 227 ºC. Thus Figure 3’s segment within the range 100 – 220º is not a closed binodal. Figure 3 merely shows that below 100 ºC, three species constitute the solid residue, i.e., (1) H2O desorbed from
= 227 ºC. Thus Figure 3’s segment within the range 100 – 220º is not a closed binodal. Figure 3 merely shows that below 100 ºC, three species constitute the solid residue, i.e., (1) H2O desorbed from ![]() or
or ![]() , (2) H2O organized in
, (2) H2O organized in ![]() and (3) H2O organized in
and (3) H2O organized in ![]() . In the range of 100 – 227 ºC two species constitute the residue, (1) H2O organized in
. In the range of 100 – 227 ºC two species constitute the residue, (1) H2O organized in ![]() and (2) H2O organized in
and (2) H2O organized in ![]() . Above 227 ºC, only one species constitute the residue — H2O organized in
. Above 227 ºC, only one species constitute the residue — H2O organized in ![]() . These persist up to their critical temperature of about 650 ºC.
. These persist up to their critical temperature of about 650 ºC.
The solid residue left over after lyophilization of INW (RINW) is a multi-component system. One order parameter cannot characterize it. For the phase transition leading to H2O organizing in ![]() at about 650 ºC, the order parameter is the remnant polarization in the mesoscopic
at about 650 ºC, the order parameter is the remnant polarization in the mesoscopic ![]() , see Figure 2 in Reference 39. Relevant coordinates for the phase plane are the remnant polarization and temperature. For the phase transition leading to H2O organizing in
, see Figure 2 in Reference 39. Relevant coordinates for the phase plane are the remnant polarization and temperature. For the phase transition leading to H2O organizing in ![]() at about 227 ºC, relevant order parameters are the density difference between
at about 227 ºC, relevant order parameters are the density difference between ![]() and gas-phase H2O, or the fraction of H2O organized in
and gas-phase H2O, or the fraction of H2O organized in ![]() (see Figure 6 in Reference 58). Relevant coordinates for the phase plane are the density difference and temperature, or the fraction of H2O organized in
(see Figure 6 in Reference 58). Relevant coordinates for the phase plane are the density difference and temperature, or the fraction of H2O organized in ![]() and the temperature.
and the temperature.
Reviewer 1: Which are the molecular mechanisms which possibly explain the measured physicochemical characteristics? Which are the time scales involved?
Yinnon, Elia, Napoli, Germano, and Liu: In our view, the most important change of pure water induced by the process leading to INW pertains to its pH. The pH of the Milli-Q water we used was 5.8. The INW preparation procedure reduced it considerably. For some INW samples the pH was as low as 2.5. This means a variation of the H3O+ concentration of more than three orders of magnitude! We again emphasize that the liquid INW is water modified by prolonged contact with the Nafion sheet, but no longer in contact with it and its EZ!
To clarify the extraordinary change, let us consider the following example: suppose that you are studying a sample of INW with pH = 3. The concentration of H3O+ is 1×10⁻³ mol L-1. What could be the negatively charged chemical species which is the counter ion of 1×10⁻³ mol L-1 of H3O+? The value of the water autoprotolysis constant [H3O+] x [OH–] = 1×10-14 implies [OH–] = 1×10-11 mol L-1, i.e., a negligible amount which cannot neutralize the positive charges of H3O+. Given the chemical composition of the INW liquid, it is rather difficult to imagine the presence of a negative counter ion at such a high concentration! Our chemical analyses only revealed traces of F–and HSO3–. So, the working hypothesis we adopted is: OH- ions are the only natural counter ions of H3O+! The presence of aggregates of water molecules in the liquid INW has been clearly highlighted by fluorescence microscopy. Their presence was also demonstrated by Atomic Force Microscopy of the solid obtained by evaporation of the bulk water at ambient pressure and temperature. We suppose that the counter ions of H3O+ are bonded to the water molecules aggregates. As such, they are subtracted from their contribution to the pH, but still assure the electro-neutrality of the system. For the molecular mechanism explaining INW’s electrical conductivity we refer to our working hypothesis described in paragraph iv of our section “Evidence for ![]() and
and ![]() dispersed in the INW liquid”.
dispersed in the INW liquid”.
As to the time scales for the aggregates formation during the INW preparation process, we recall that the aggregates’ ferroelectric ordering of H2O implies a rotational population inversion process. The time scales for such a process are of the order of minutes or days, as estimated in paragraph v of our section “Evidence for ![]() and
and ![]() dispersed in the INW liquid”.
dispersed in the INW liquid”.
Reviewer 1: How do these mechanisms influence the charge distribution, electrical conductivity, and the water density?
Yinnon, Elia, Napoli, Germano, and Liu: According to the working hypothesis we presented in our previous answer, the charge distribution is anisotropic. The OH- are bonded to the irregular shaped aggregates and the H3O+ counter ions are distributed in the bulk water. The electrical conductivity and density, of course, are affected by the presence of the new ‘solutes’, i.e., the aggregates of water molecules. As discussed in References 33, 53 and 73: the H2O constituting ![]() and
and ![]() oscillate coherently; their coherence implies these are superfluidic domains, i.e., their H2O do not collide because a single collision would destroy the coherence; stabilization of these domains therefore enhances the liquid’s electrical conductivity. Due to the aggregates, the density of INW differs from that of non-perturbed water. The density of
oscillate coherently; their coherence implies these are superfluidic domains, i.e., their H2O do not collide because a single collision would destroy the coherence; stabilization of these domains therefore enhances the liquid’s electrical conductivity. Due to the aggregates, the density of INW differs from that of non-perturbed water. The density of ![]() is higher than that of bulk water, while that of
is higher than that of bulk water, while that of ![]() is lower. Our density measurements show that the density of all our INW samples is higher than that of the Milli-Q water from which it was prepared, hinting at
is lower. Our density measurements show that the density of all our INW samples is higher than that of the Milli-Q water from which it was prepared, hinting at ![]() prevalence.
prevalence.![]()
References
1. Henniker JC (1949). Rev Mod Phys 21: 322.
2. Zheng JM and Pollack GH (2003). Phys Rev E: Stat Nonlinear, Soft Matter Phys 68: 031408.
3. Zheng JM, Chin WC, Khijniak E, Pollack GH (2006). Adv Coll Inter Sci 127: 19.
4. Carrasco J, Hodgson A, Michaelides A (2012). Nature Material 11: 667.
5. Bunkin NF, Ignatiev PS, Kozlov VA, Shkirin AV, Zakharov SD and Zinchenko AA (2013). WATER Journal 4: 129.
6. Tychinsky V (2011). WATER Journal 3: 95.
7. Gun’ko VM, Turov VV, Bogatyrev VM, Zarko VI, Leboda R, Goncharuk EV, Novza AA, Turov AV, Chuiko AA (2005). Adv Coll Inter Sci 118: 125.
8. Mártonfalvi Z and Kellermayer MSZ (2008). Nanomechanics of exclusion-zone water. Proceedings of 2008 Meeting on Physics, Chemistry and Biology of Water, Mount Snow, Vermont, USA.
9. Chai B, Mahtani AG, Pollack GH (2012). Contemp Mater 3: 1-12.
10. Germano R, Del Giudice E, De Ninno A, Elia V, Hison C, Napoli E, Tontodonato V, Tuccinardi FP, Vitiello G (2013). Key Engineering Materials 543: 455.
11. Liu ZQ, Zhang GC, Li YJ, Jiang SR (2012). Phys Rev E 85: 036314.
12. Shirsavar R et al. (June 9, 2008). Liquid motor revs up. Scientific American.
13. Chai B, Yoo H, Pollack GH (2009). J Phys Chem B 113: 13953.
14. Zheng JM, Wexler A, Pollack GH (2009). J Colloid Interface Sci 332: 511.
15. Chai B and Pollack GH (2010). J Phys Chem B 114: 5371.
16. Yoo H, Paranji R, Pollack GH (2011). J Phys Chem Lett 2: 532.
17. Yoo H, Baker DR, Pirie CM, Hovakeemian B, Pollack GH (2010). Characteristics of water adjacent to hydrophilic interfaces. In: D. LeBihan, H. Fukuyama, editors. Water, the Forgotten Biological Molecule. Pan Stanford Publishing Pte. Ltd.
18. Nhan DT and Pollack GH (2011). Int J Des Nat Ecodyn 6: 139.
19. Nagornyak E, Yoo H, Pollack GH (2009). Soft Matter 5: 3850.
20. Chai B, Zheng J, Zhao Q, Pollack GH (2008). J Phys Chem A 112: 2242.
21. Zheng JM, Pollack GH (2006). Solute exclusion and potential distribution near hydrophilic surfaces. In: Water and the Cell. Springer, Netherlands.
22. Pollack GH, Clegg J (2008). Unexpected linkage between unstirred layers, exclusion zone, and water. In: Phase Transitions in Cell Biology. Springer, New York.
23. So E, Stahlberg R, Pollack GH (2011). Exclusion zone as intermediate between ice and water. In: Water and Society. WIT Press, Southampton.
24. Elia V, Napoli E, Niccoli M (2013). J Therm Anal Calorim 112: 937.
25. Elia V, Ausanio G, De Ninno A, Gentile F, Germano R, Napoli E, Niccoli M. (2013). WATER Journal 5: 16.
26. Elia V, Lista L, Napoli E, Niccoli M (2014). J Therm Anal Calorim 115: 1841.
27. Carrasco J, Klimeš J, Michaelides A (2013). J Chem Phys 138: 024708.
28. Ferri N, DiStasio RA, Ambrosetti A, Car R, Tkatchenko A (2015). Phys Rev Lett 114: 176802.
29. Robinson RA and Stokes RH. (1959). Electrolyte Solutions. Dover Publications Inc., Mineola, New York.
30. Buch V, Tarbuck T, Richmond GL, Groenzin H, Li I, Shultz MJ (2007). J Chem Phys 127: 204710.
31. Noguchi H, Hiroshi M, Tominaga T, Gong JP, Osada Y, Uosaki K (2008). Phys Chem Chem Phys 10: 4987.
32. Faraudo J (2011). Current Opinion in Colloid & Interface Science 16: 557.
33. Del Giudice E, Spinetti PR, Tedeschi A (2010). Water 2: 566.
34. Del Giudice E, Tedeschi A, Vitiello G, Voeikov V (2013). J Phys: Conf Ser 442, 012028.
35. Del Giudice E, Voeikov V, Tedeschi A, Vitiello G (2014). The origin and the special role of coherent water in living systems. Chapter 5 in: Fields of the Cell. D. Fels, M. Cifra and F. Scholkman, editors. Research Signpost, Kerala, India.
36. Roy BN (2002). Fundamentals of classical and statistical thermodynamics. Wiley, West Sussex, UK.
37. Onsager L (1936). Electric Moments of Molecules in Liquids. J Amer Chem Soc 58: 1486-1493.
38. Kirkwood JG (1939). The Dielectric Polarization of Polar Liquids. J Chem Phys 7: 911-918.
39. Sivasubramanian S, Widom A, Srivastava YN (2005). Physica A 345: 356.
40. Martin DR and Matyushova DV (2008). Microscopic fields in liquid dielectrics. J Chem Phys 129: 174508.
41. Feynman RP, Leighton RB, Sands M. (1964). Feynman Lectures on Physics. Vol. 2, chap. 11. Addison Wesley.
42. Geiger R and Klapp SHL (2013). Dimensionality Effects in Dipolar Fluids: A Density Functional Theory Study. J Mod Phys 4: 401-408.
43. Del Giudice E and Vitiello G (2006). Phys Rev A 74: 022105.
44. Blasone M, Jizba P, Vitiello G (2011). Quantum theory and its macroscopic manifestations. Imperial College Press, London.
45. Groh B and Dietrich S (1994). Phys Rev Lett 72: 2422.
46. Wei D and Patey GN (1992). Phys Rev Lett 68: 2043.
47. Klapp SHL (2005). Dipolar fluids under external perturbations. J Phys Condens Matter 17: R525-R550.
48. Brändas EJ (2009). Complex Symmetry, Jordan Blocks and Microscopic Self-organization. In: Self Organization of Molecular Systems. Eds. N. Russo, V.Y. Antonchenko, E.S. Kryachko. NATO Science for Peace and Security Series A: Chemistry and Biology: pp 49-87 and references therein.
49. CRC Handbook of Chemistry and Physics (2001). CRC Press, Cleveland, USA.
50. Weis JJ (2003). J Phys Condens Matter 15: S1471.
51. Leroy F, dos Santos DJVA, Müller-Plathe F (2009). Macromol Rapid Commun 30: 864.
52. Del Giudice E, Preparata G, Vitiello G (1988). Phys Rev Lett 61: 1085.
53. Yinnon TA and Elia V (2013). Int J Mod Phys B 27: 1350005.
54. Fenn EE, Wong DB, Fayer MD (2009). Proc Natl. Acad Sci USA 106: 15243.
55. Liu ZQ, Li YJ, Zhang GC, Jiang SR (2011). Phys Rev E 83, 026303.
56. Liu ZQ, Jiang SR, Yinnon TA, Kong XM, Li YJ (2016) Effects of interfaces on dynamics in micro-fluidic devices: slip-boundaries’ impact on rotation characteristics of polar liquid film motors. To be submitted.
57. Nakamura Y and Ohno T (2011). Phys Chem Chem Phys 13: 1064.
58. Arani R, Bono I, Del Giudice E, Preparata G (1995). Int J Mod Phys B 9, 1813.
59. Ho MW (2014). WATER Journal 6: 1.
60. Di Stasio RA, von Lilienfeld OA, Tkatchenko A (2012). Proc Natl Acad Sci USA 109: 14791.
61. Jones AP, Crain J, Sokhan VP, Whitfield TW, Martyna GJ (2013). Phys Rev B 87: 144103.
62. Sivasubramanian S, Widom A, Srivastava YN (2001). Physica A 301, 241.
63. Del Giudice E, Mele R, Preparata G (1993). Mod Phys Lett B 7: 1851.
64. Del Giudice E, Galimberti A, Gamberale L, Preparata G (1995). Mod Phys Lett B 9: 953.
65. Bono I, Del Giudice E, Gamberale L, Henry M (2012). Water 4: 510.
66. Yinnon CA and Yinnon TA (2009). Mod Phys Lett B 23: 1959.
67. Röntgen WC (1892). Ann Phys 281: 91.
68. Mishima O and Stanley HE (1998). Nature 396: 329.
69. Poole PH, Sciortino F, Essmann U, Stanley HE (1992). Nature 360: 324.
70. Stokely K, Mazza MG, Stanley HE, Franzese G (2010). Proc Nat Acad Sci 107: 1301.
71. Huang C et al. (2009). Proc Natl Acad Sci USA 106: 15214-15218.
72. Taschin A, Bartolini P, Eramo R, Righini R, Torre R (2013). Nature Commun 4:2401.
73. Yinnon TA and Liu ZQ (2015) WATER Journal 7: 33. idem 48; idem 70.
74. Preparata G (1995). QED Coherence in Matter. World Scientific, Singapore, New Jersey, London, Hong Kong.
75. Del Giudice E, Fuchs EC, Vitiello G (2010). WATER Journal 2: 69-82.
76. Nakamoto K (1997). Infrared and Raman spectra of inorganic and coordination compounds. Wiley, West Sussex, UK.
77. De Ninno A, Congiu Castellano A (2011). J Molec Structure 1006: 434.
78. De Ninno A, Congiu Castellano A, Del Giudice E (2013). J Phys: Conference Series 442: 012031.
79. Pershin SM, Bunkin AF, Lukyanchenko VA, Nigmatullin RR (2007). Laser Phys Lett 4: 809.
80. Arakawa M, Kagi H, Fukazawa H (2009). Astrophysical Journal Supplement Series 184: 361.
81. Grimmett G (1999). Percolation. Grundlehren der mathematischen Wissenschaften, Vol. 321. Springer.
82. Vrbka L and Jungwirth P (2005). Phys Rev Lett 95: 148501.
83. Gross GW, Wong PM, Humes K (1977). J Chem Phys 67: 5264.
84. Cogoni M, D’Aguanno B, Kuleshova LN, Hofman DWM (2011). J Chem Phys 134: 204506.
85. Iitaka T (2010). arXiv:1007.1792v1 cond-mat.mtrl-sci.
86. Yokono T, Shimokawa S, Yokono M, Hattori H (2009) WATER Journal 1: 29.
87. Toyama N, Kohno JY, Kondow T (2006). Chem Phys Lett 420: 77.
88. Amjadi A, Shirsavar R, Radja NH, Ejtehadi MR, (2009). Microfluid Nanofluid 6: 711.
89. Capolupo A, Del Giudice E, Elia V, Germano R, Napoli E, Niccoli M, Tedeschi A, Vitiello G (2014). Int J Mod Phys B 28: 1450007.