
 Long-Term Drainage from the Riprap Side Slope of a Surface Barrier
Zhuanfang Fred Zhang*
*Corresponding author
Hydrology Group, Earth Systems Science Division, Pacific Northwest National Laboratory, Richland WA 99352
Email: fred.zhang@pnnl.gov
Keywords: Surface Barrier; Surface Cover; Gravel; Evaporation
Received August 23, 2016; Revised April 29, 2017; Accepted May 8, 2017; Published July 1, 2017;
Available Online July 21, 2017.
Abstract
Surface barriers for containing under-ground nuclear waste in place are expected to function for 1000 years. Riprap, which consists of very coarse rock fragments, has been used to protect surface barriers against wind- and water-induced erosion and damage by other natural or human activities. Although drainage from riprap could affect the hydrological performance of a surface barrier, there have been very few quantitative investigations of drainage from riprap. A riprap side slope was installed on a portion of the Prototype Hanford Barrier, which was constructed in 1994 at the Hanford Site, Washington, USA. Drainage through the riprap side slope was monitored from 1994 to 2013 under natural and enhanced precipitation conditions. Results show that, when the precipitation was lower than about 200 mm yr-1, roughly 6% of the precipitation became drainage; when the annual precipitation was higher than 200 mm yr-1, approximately 60% of the additional precipitation drained through the riprap. On average, 12.9% and 40.5% of the annual precipitation became drainage under natural and enhanced precipitation conditions, respectively. Internal evapo-ration may be a key mechanism moving water stored within the riprap side slope to the atmosphere.
Running Title
Drainage from a Riprap Side Slope
Keywords
Surface Barrier; Surface Cover; Gravel; Evaporation
Introduction
Surface barriers are used to isolate underground uranium tailings or other types of radioactive waste and reduce precipitation (P) recharge. Such surface barriers are expected to function for 1000 years and reduce the drainage below 0.5 mm yr–1 (DOE-RL, 1999; DOE-RL, 2016; Zhang, 2016; Zhang et al., 2017). Riprap, crushed rock with the size between about 0.1 and 0.3m, has been used as an erosion-protection layer or side slope of the very long-term (centuries to millennia) surface barriers. An issue arises because of the potentially high drainage rate from the very coarse material. Researchers (e.g., Li, 2003; Ma and Li, 2011; Qiu et al., 2014) have found that coarse material such as gravel mulching over finer soil reduces evaporation and hence enhances drainage. Gee et al. (1992) reported that, the drainage (D) counted for 48% to 59% of the precipitation in lysimeters filled with unvegetated silt covered with gravel during a period of two years. In these investigations, the gravel size was usually no more than several centimeters and the thickness of the gravel layer was generally no more than 0.1 m. Hence, water storage in these gravel layers can be considered negligible, while nearly all the precipitation stores in the underlying finer layer.
The situation is different for the relatively thicker (i.e., 1 m or more) and coarser (rock size is approximately > 0.1 m) riprap layers or side slopes. Air convection within the riprap side slope was observed and predicted by computer simulation in Bian et al. (2012), who studied the air flow distribution in a riprap slope of a railway under strong ventilation conditions. They found that turbulent air flow could happen in the riprap and the air flux near the slope surface was larger than inside the slope. These differences suggest that the results obtained based on thin layer of small gravels should not be directly applicable to the thicker layer of relatively large riprap.
Some of the water that drains through the riprap side slope of a surface barrier has the potential to migrate into the waste zone below the surface barrier and hence mobilize the contaminants in the zone. The Prototype Hanford Barrier (PHB) system (DOE-RL, 2016; Wing and Gee, 1994; Zhang, 2016) was constructed in 1994 and one side slope was constructed using basalt riprap. Drainage through the side slope was monitored from 1994 to 2013 under natural and enhanced precipitation conditions. The nearly two decades of data provide an opportunity to quantify the drainage rate from the riprap side slope. The results are useful in the design of very long-term surface barriers, in which very coarse materials such as riprap may be used to guard the barrier against erosion and damage.
The purpose of this technical note is to present the drainage rate from the PHB’s riprap side slope, understand its temporal variation, and delineate the relationship between precipitation and drainage rate based on field monitoring results from 1994 to 2013. The implications on the importance of internal evaporation in the riprap and the future design of surface barrier are discussed.
Methods and Materials
Design of the Riprap Side Slope and Field Tests
The description and design of the PHB, with an area of 2.5 ha, was reported in other sources (e.g., DOE-RL, 2016; Gee et al., 1997; Ward and Gee, 1997; Wing and Gee, 1994; Zhang, 2016; Zhang et al., 2017). It consists of a 2:1 (horizontal:vertical) riprap side slope (Figure 1). The thickness of the side slope varies from 4.3 m near the boundaries of the evapotranspiration (ET) barrier to zero at the slope toe. The side slope is made of the basalt riprap passing through 0.254-m-spaced grizzly bars. About 30% of the rock did not pass the 0.125-m-spaced bars and no more than 5% passed the 0.015 m bars. The coarse material for the side slope provides such a condition that infiltration water drains freely. From 1994 to present (2017), there was no vegetation on the riprap side slope.
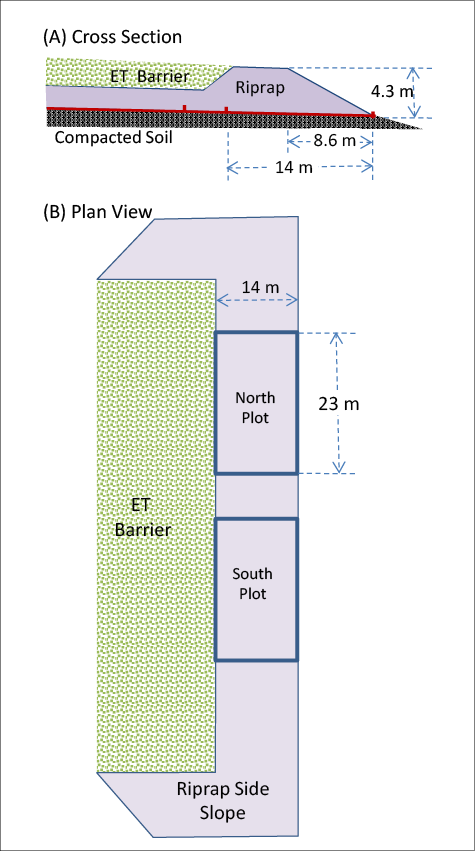
Figure 1. Schematic (not to scale) of the riprap side slope of the Prototype Hanford Barrier. The red line in plot (a) denotes the drainage layer over the curbed asphalt concrete layer coated with fluid-applied asphalt. ET: evapotranspiration.
From November 1994 to October 1997, the north section of the side slope received an enhanced amount of precipitation (natural precipitation plus supplemental irrigation) to simulate extremely wet climate conditions [about 3 times (3X) the average precipitation], while the south section received only natural precipitation. To synchronize with the natural storage and release processes in the barrier, the irrigation was conducted on a water-year (WY) basis. A WY starts in November of the previous year and ends in October of current year. Irrigation water was usually applied at biweekly intervals, except in winter and depending on the weather. The total meteoric precipitation and irrigation was 493.3, 493.1, and 499.7 mm for WY95 through WY97, respectively. After that, both the north and south sections of the side slope were exposed to natural precipitation only.
Monitoring Drainage
The riprap side slope is underlain by a low-permeability asphalt concrete (AC) layer coated with fluid-applied asphalt (with a 2% slope), which was covered with a 0.3-m-thick layer of gravel to facilitate lateral water movement toward the lower slope positions of each collection zone (Figure 1). Below the slope the AC layer contained two 322 m2 (23×14 m) curbed plots (the north and south in Figure 1b), from which the drainage was guided to two concrete vaults containing a drainage monitoring system. Each vault was equipped with a lid to prevent precipitation from entering. The lid was covered with a thick tarp to prevent the water in the vault from freezing or evaporating. The drainage rate from each plot was measured with a submerged Druck pressure transducer (Instrumart, South Burlington, VT) by recording hydrostatic pressure in the vault at intervals ranging from 10 minutes to 1 hour. The drainage rate from each plot was also measured with a tipping bucket. Drainage water flowed into each vault via a tipping bucket. The tipping buckets tended to underestimate the rate of flow from the side slope because they might not have responded fast enough to high flow rates. However, in the years of WY06, WY07, WY11, and WY12, the pressure transducer measured zero or negative drainage rates for the south plot. Hence, the corresponding values from the tipping bucket were used for these years for the south plot. The measurements for WY95, WY08, WY09, and WY13 were incomplete and hence were excluded in the analysis.
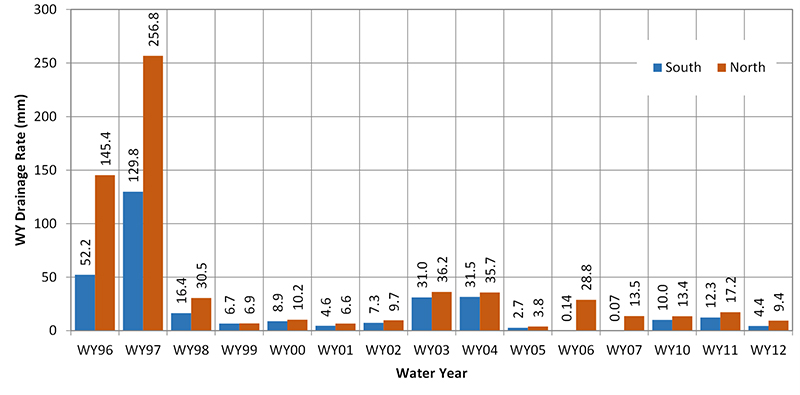
Figure 2. Annual drainage from the riprap side slope. The north section received enhanced (3X the average) precipitation from WY95 to WY97.
Results and Discussion
Annual Drainage
Figure 2 shows the WY drainage rates through the side slope. The maximum drainage was 256.8 mm yr-1 under enhanced P (north plot). The maximum drainage under natural precipitation (south plot) was 129.8 mm yr-1. Both maximums occurred in WY97, which had the highest (290 mm, 1.7X the average) precipitation. On average, 23.8 mm/yr (12.9% of P) and 201.1 mm/yr (40.5% of P) ended up as D under natural and the enhanced P condition, respectively. These drainage rates are lower than the value (i.e., 48% to 59%) from gravel-covered soil as reported in Gee et al. (1992). When P was about 3X the average, the drainage rate increased by a factor of about 8.
From WY98 to WY12, both the north and south sections were under natural precipitation. Figure 2 indicates that the drainage from the south section was generally smaller than the north. This can be partially attributed to the difference of actual drainage for the two plots and partially to measurement error.
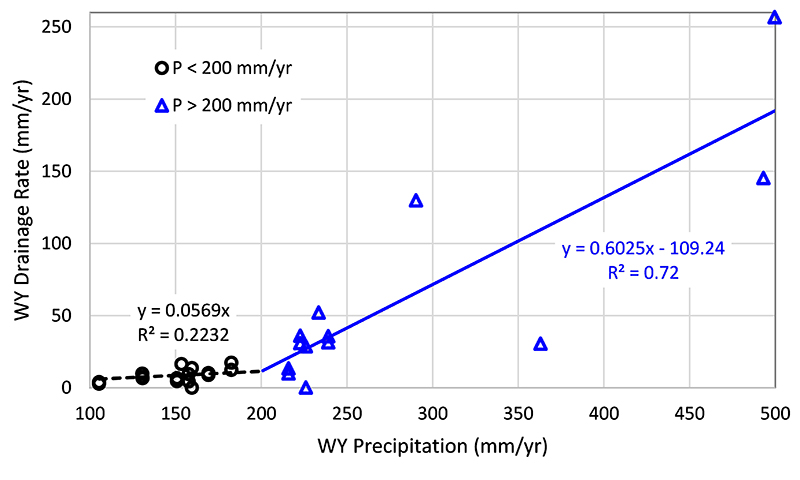
Figure 3. The relation between WY drainage and precipitation. The dashed and solid lines indicate linear regressions.
Figure 3 shows the relationship between WY drainage rate and annual precipitation. On average, when P is less than approximate 200 mm yr-1, there was a weak correlation between P and D, indicating only about 6% of P became drainage and the rest of the precipitation was first stored in the riprap side slope and then released into the atmosphere via evaporation. When P is greater than about 200 mm yr-1, an average of 60% of the additional annual precipitation drained through the riprap. These results suggest that the precipitation in the very wet years is the primary contributor to subsurface drainage through the riprap side slope.
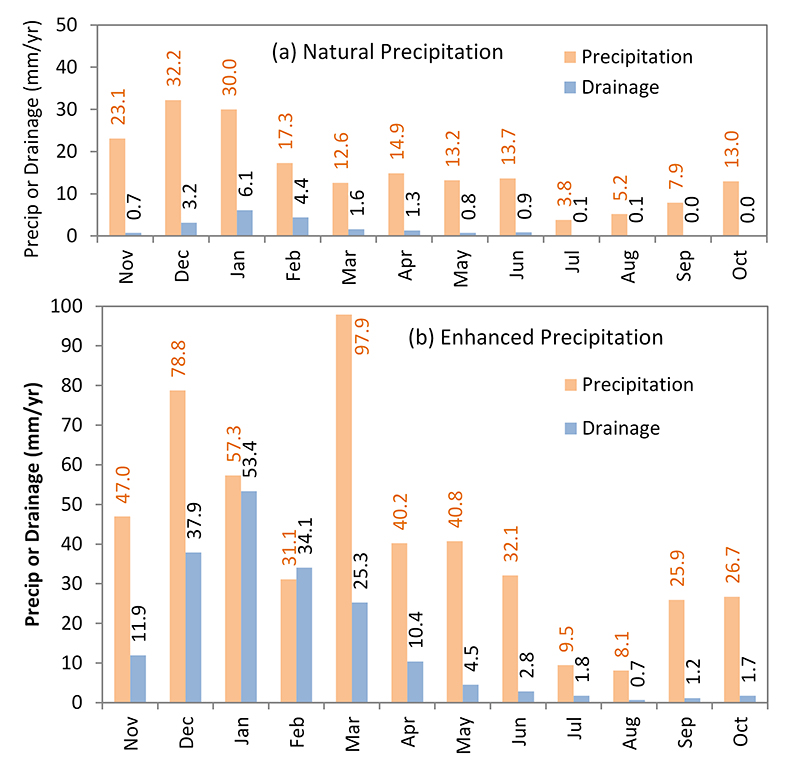
Figure 4. Monthly average drainage through the riprap side slope during the monitoring periods under the conditions of a) natural precipitation (WY96 to WY97 for the south plot and WY98 to WY12 for both plots) and b) enhanced precipitation (WY96 to WY97).
Seasonal Drainage
To understand the seasonal distribution of drainage, the multi-year average monthly drainage rates for the riprap side slope are shown in Figure 4. The highest drainage rates generally occurred in January of each year and the lowest rates usually in late summer or early fall, indicating that most of the summer precipitation was released into the atmosphere via evaporation. This pattern agrees with the climate of the site, a wet cool winter and a dry hot summer.
Under the natural precipitation condition (Figure 4a), the drainage through the riprap side slope was 0.8 to 5.8 mm per month in the cold winter months (i.e., Nov. to Mar.) but no more than 1.3 mm per month in the hot summer months (i.e., April to Oct.). The pattern of seasonal drainage variation under the enhanced precipitation condition (Figure 4b) was similar to that under the natural precipitation condition (Figure 4a) except that the drainage rates were much larger. Under natural precipitation conditions from WY96 to WY12, an average of 13.5% of the winter-season P and 4.3% of the summer-season P ended up as drainage. Under the enhanced precipitation from WY96 to WY97, the corresponding values were 52.1% and 12.6%. It is pointed out that many factors such as rainfall intensity and distribution, rock wetness and temperature, and weather conditions (air temperature, humidity, wind velocity, and solar radiation) affect the fraction of precipitation that leads to drainage. The impact of each individual factor cannot be distinguished from that of others in this investigation. The results here represent the average phenomenon of the test period.
Discussions
Water Storage and Evaporation within the Riprap Side Slope
The monitoring results demonstrate that, although the riprap has a very low water holding capacity, it is sufficient to store most of the precipitation long enough to allow evaporation to release it back to the atmosphere. This may be attributed to the water stored as thin water films on the rock fragment surfaces and the large thickness of the side slope. According to Tokunaga and Wan (1997), the thickness of the water film on rock surfaces can be up to about 0.1 mm. Assuming that the riprap side slope has a porosity of 0.3 and the rock fragments are 0.1-m-radius spheres with a 0.1-mm-thick water film, the estimated water content is 0.002 m3m-3, which is equivalent to 6 mm water storage for a riprap layer of 3-m thickness. Although this storage capacity is very low, it is sufficient to store the average monthly precipitation in July, August, or September, and about half of the average monthly precipitation in April, May, June and October. At Hanford, an average of 122 days per year have a trace or more of precipitation; only 23 days receive totals of 2.5 mm or more (Hoitink et al., 2005). Hence, a considerable fraction of the infiltrated water can be stored as thin films on rock surfaces and evaporated by the multi-dimensional convection of air through the riprap side slope between precipitation events. This internal evaporation process likely becomes important when air convection is substantial. Because riprap consists of basalt fragments that have irregular shapes, different sizes, and a relatively rough surface, the riprap could have thicker water film, larger surface area, and hence higher storage capacity than the estimated value above. The relatively high evaporation from the riprap side slope suggests that internal evaporation, which is the loss of water on rock surfaces because of convective air, should be an important mechanism to release precipitation into the atmosphere. Internal evaporation within a rock pile was indicated by stable isotopes (i.e., deuterium and 18O) by Sracek et al. (2004). As a result, the drainage rate from the riprap side slope tends to be lower than that from the gravel-covered sand or silt.
As time goes on, wind-blown dust may settle into the riprap and fill a fraction of the pore space. This process may lead to less internal evaporation and hence more drainage. There is a possibility that native vegetation (e.g., shrubs and grasses) will eventually develop on the riprap side slope. The vegetation is expected to enhance the evapotranspiration process and the roots can bind the relatively smaller rock together. However, the roots may also detach some interlocked ripraps and hence can destabilize the slope. Hence, the combined effect of dust and vegetation on drainage from and stability of the riprap side slope could be positive or negative.
Implications for the Design of a Surface Barrier
Because the average drainage rate through the riprap side slope is much higher than the design criterion (0.5 mm yr-1) of the PHB, there is a concern that some of the drainage beneath the riprap side slope could migrate laterally beneath the barrier and decrease the barrier’s effectiveness at isolating buried waste. This “edge effect” is affected by a few factors (e.g., soil properties, barrier and slope size, and time) and can be quantified numerically. Different strategies can be used to design a barrier system so that the drainage water from the side slope is properly managed. For example, the lateral extent of the barrier can be expanded to increase the protected zone and minimize the impact of any edge effect. The low-permeability layer (like the AC) can be extended under the side slope and the water collected can be routed far from the barrier.
Summary
The monitoring results from 1994 to 2013 at a riprap side slope show that the highest drainage rates generally occurred in January of each year and the lowest rates usually in late summer or early fall, indicating that most of the summer precipitation was released into the atmosphere by evaporation. On average, 12.9% and 40.5% of the annual precipitation ended up as drainage under natural and enhanced precipitation condition, respectively. When the annual precipitation was less than about 200 mm yr-1, roughly 6% of the precipitation became drainage, indicating a very high fraction of the precipitation was first stored in the side slope and then released into the atmosphere via evaporation. However, when the annual precipitation was higher than about 200 mm yr-1, approximately 60% of the additional precipitation drained through the riprap. The relatively high evaporation rate from the riprap side slope suggests that internal evaporation is an important mechanism to release precipitation into the atmosphere. However, the drainage rate from the riprap is much higher than the design criterion of 0.5 mm yr‑1 of the surface barrier and hence needs to be managed properly to prevent the drainage water from moving into the waste zone below the surface barrier.
Acknowledgement
Funding for this research was partially provided by the U.S. Department of Energy Richland Operations Office under the Deep Vadose Zone Project. Pacific Northwest National Laboratory is operated for the U.S. Department of Energy by Battelle under Contract DE-AC05-76RL01830.
References
Bian, H.L., P. He, Q.B. Wu and Y.H. Shi. 2012. Numerical analysis of forced convection characteristics of riprap slope embankment in Qinghai-Tibet railway. Rock and Soil Mechanics 33: 377-383.
DOE-RL. 1999. 200-BP-1 Prototype Barrier Treatability Test Report. U.S. Department of Energy Richland Operations Office, Richland, Washington.
DOE-RL. 2016. Prototype Hanford Barrier 1994 to 2015. U.S. Department of Energy Richland Operations Office, Richland, Washington.
Gee, G.W., M.J. Fayer, M.L. Rockhold and M.D. Campbell. 1992. Variations in Recharge at the Hanford Site. Northwest Science 66: 237-250.
Gee, G.W., A.L. Ward and M.J. Fayer. 1997. Surface barrier research at the Hanford Site. Land Contamination & Reclamation 5: 233-238.
Hoitink, D.J., K.W. Burk, J.V. Ramsdell (Jr.) and W.J. Shaw. 2005. Hanford Site Climatological summary 2004 with Historical data. Pacific Northwest National Laboratory, Richland, Washington.
Li, X.-Y. 2003. Gravel–sand mulch for soil and water conservation in the semiarid loess region of northwest China. Catena 52: 105-127.
Ma, Y.J. and X.Y. Li. 2011. Water accumulation in soil by gravel and sand mulches: Influence of textural composition and thickness of mulch layers. Journal of Arid Environments 75: 432-437.
Qiu, Y., Z. Xie, Y. Wang, J. Ren and S.S. Malhi. 2014. Influence of gravel mulch stratum thickness and gravel grain size on evaporation resistance. Journal of Hydrology 519: 1908-1913.
Sracek, O., M. Choquette, P. Gélinas, R. Lefebvre and R.V. Nicholson. 2004. Geochemical characterization of acid mine drainage from a waste rock pile, Mine Doyon, Québec, Canada. Journal of Contaminant Hydrology 69: 45-71.
Tokunaga, T.K. and J. Wan. 1997. Water film flow along fracture surfaces of porous rock. Water Resources Research 33: 1287-1295.
Ward, A.L. and G.W. Gee. 1997. Performance evaluation of a field-scale surface barrier. Journal of Environmental Quality 26: 694-705.
Wing, N.R. and G.W. Gee. 1994. Quest for the perfect cap. Civil Engineering 64: 38-41.
Zhang, Z.F. 2016. Evaluating the long-term hydrology of an evapotranspirationcapillary barrier with a 1000 year design life. Water Resources Research 52.
Zhang, Z.F., C.E. Strickland and S.O. Link. 2017. Design and Performance Evaluation of a 1000-year Evapotranspiration-Capillary Surface Barrier. Journal of Environmental Management 187: 31-42.
Discussion with Reviewers
Reviewer 2: Since riprap side slope has a recharge problem why didn’t the constructers glue the rocks together or seal the slope surface using cement or concrete to avoid this problem?
Even if the side slope is cemented, precipitation will tend to accumulate and drain in the area near the foot of the slope. Hence, cementing the side slope cannot eliminate drainage. Further, the surface barrier is expected to last for at least 1000 years and to be maintenance-free. Cement or concrete tends to crack gradually because of the temperature-caused shrink-swell effect and hence will cause drainage through the cracks.
Reviewer 2: During winter seasons, the snow could accumulate on the slope surface and melt in early spring. Did this phenomenon have an impact on the drainage rate of riprap side slope?
It is understandable that precipitation in the form of snow may only infiltrate after the snow has melted. Because evaporation at the surface of snow is generally slow, most snow eventually will infiltrate into the side slope. However, the un-melted snow affects the temporary distribution of drainage and hence short-term (e.g., weekly or monthly) water balance without considering the precipitation form (i.e., rain or snow) leads to calculation error depending how much snow is precipitated and melts during the period of calculation. If the calculation is for a long enough period so that all the snow melts within the period, the calculation is not affected by the form of precipitation. An exception is that wind may blow the snow around to cause runoff from or run-on to the side slope. Because the Prototype Hanford Barrier and the monitoring system are under the natural conditions, there is relatively large spatial and temporal variability in the data. Hence, the impact of snow cannot be distinguished from that of rain.
Reviewer 2: The drainage rate from the riprap is much higher than the design criterion of 0.5 mm yr-1. Is there any remedial work that can be done to reverse it?
The criterion of 0.5 mm yr-1 applies to the functioning evapotranspiration (ET) barrier (Fig. 1). The functionality of the side slope is to protect the ET barrier from intrusion by human, animals, and plants and from soil erosion. No effective method has been found to reduce the drainage from the side slope without interfering with its functionality. To address the problem of high drainage rate from the side slope, the ET barrier must be large enough laterally so that the drainage from the side slope will not go through the waste zone.
Reviewer 3: The contact of irregular particles may produce some contact points and small dead pores, and they can store some water. The water was released to atmosphere by water vapor diffusion.
The riprap size is quite large (10 to 25 cm), so the contact points are considered limited. Vapor diffusion certainly is a transport mechanism, but usually it is relatively slow. In this case, convection is suspected to play a dominant role in vapor transport in the riprap.