
 Assessing the Specific Impacts of Climate Variability and Human Activities on Annual Runoff Dynamics in a Southeast China Coastal Watershed
Ervinia A, Huang J*, Zhang Z
Coastal and Ocean Management Institute, Xiamen University, China 361005;
*Correspondence to: Jinliang Huang (jlhuang@xmu.edu.cn)
Keywords: climate change, human activities, hydrological sensitivity analysis, runoff, Jiulong River Watershed
Received: March 16, 2017; Revised: October 16, 2017; Accepted: November 6, 2017; Published: January 30, 2018; Available Online: January 30, 2018
Abstract
Understanding how climate variability and human activities interact to affect watershed hydrology is needed for adaptive watershed management. The Mann-Kendall test and hydrological sensitivity analysis were coupled in this study to evaluate the specific impacts of climate variability and human activities on the change in mean annual runoff for the Jiulong River Watershed using a long-term hydro-climatic data during 1961-2013. Based on the results of MK test, the study period was divided into two periods, the baseline period (1961-1974) and the altered period (1975-2013). The mean annual runoff during the altered period increased by 31 mm (3.5%) and 93 mm (11.6%) for the North and West Rivers, respectively, compared with that of baseline period. Climate variability was identified as the dominant factor controlling the increased annual runoff, accounted for 58 mm (193%) and 90 mm (97%) of the changes in the North and West Rivers, respectively. Human activities (e.g. increasing water withdrawal, cascade dams, and reforestation) played a more important role in the reduction of annual runoff, particularly in the North River of about 27 mm. The present study suggests that human activities may buffer the severity of hydrological changes associated with climate changes, particularly in Southeast China region where more intense and extreme weather events have been experienced.
Introduction
Climate change and human activities are two factors contributing to watershed hydrology, which greatly influences the local and regional drinking water security and aquatic ecosystem health (Huang et al., 2013; Piao et al., 2010; Zhao et al., 2014). Understanding how the two factors affect river runoff dynamics is essential for water resource management, especially in coastal watersheds where peoples are heavily concentrated and reliant on water resources (NOAA, 2013).
Climate change contributes to river runoff dynamics across various physiographic regions. A general pattern of increasing runoff has been projected and reported in high latitudes, East Asia, South Asia, eastern Africa, Canada, and in parts of South America (Arnell and Gosling, 2013; Huang et al., 2014; Milly et al., 2005; Moraes et al., 1998). As most land-based pollutions are exported through runoff, the magnified annual runoff may amplify nutrient and sediment transports, resulting in more frequent harmful algal bloom and hypoxia in coastal water (Hägg et al., 2014; Lee et al., 2015). However, changes in annual runoff cannot be attributed solely to climate changes because non-climatic factors also exert substantial impacts on watershed hydrology (Bronstert et al., 2002; Hopkins et al., 2015; Zhang et al., 2015; Zimmermann et al., 2006). Research suggests that change in land-use practices affect streamflow regime. Increasing streamflow might be affected mainly by agricultural activities rather than climate changes (Zhang and Schilling, 2006). Changes associated with urban development include decreased vegetation and increased impervious cover can contribute to flooding (Martin et al., 2012; Remondi et al., 2016), whereas reforestation can lead to large decreases of long-term annual runoff (Trabucco et al., 2008). Increasing water demand for agricultural, industrial, and domestic purposes has also been responsible for the decrease of annual runoff in many rivers (Zhang et al., 2011). Besides, watershed morphology played an indirect, but important role in determining how watersheds respond to long-term changes in climatic variables (Rice et al., 2016). The complexity of human activities in a catchment could exert the linear or non-linear impacts resembling the effects of climate change on runoff. Therefore, whether the change in annual runoff is induced by climate changes or human activities is still in question.
In recent years, a number of studies have been conducted to distinguish effects of climate change and human activity on watershed hydrology. The research methods can be divided into four types: simple regression techniques, modeling-based approach, conceptual model, and climate elasticity model. By using regression techniques, some researchers identified a non-linear rainfall-runoff relationship and suggested that human activity, rather than climate change is the major factor of runoff decline in North China rivers (Yang and Tian, 2009; Zhang et al., 2011). But this method could not estimate clearly the individual contribution of these two factors on the change in runoff. Other studies simulated the response of runoff to different scenarios of land-use or climate changes with the aid of semi-distributed hydrological models such as SWAT, PRMS, HEC-HMS, etc. (Ahn and Merwade, 2014; Ficklin et al., 2009; Legesse et al., 2003). However, the interpretation of the results derived from hydrological models can be difficult due to uncertainties in parameter calibration and limitations of long-term data. The third method is a simple conceptual model proposed by Tomer and Schiling (2009) to empirically distinguish the relative impact of climate change and land-use on runoff based on coupled water-energy budget analysis. However, this method does not quantitatively estimate contributions of climate and human activity to runoff, so we cannot fully delineate the interaction between these two factors on river runoff. The fourth method is using the climate elasticity model to predict the sensitivity of annual runoff to climate change given the change in precipitation and potential evapotranspiration (Arora, 2002; Dooge, 1992; Koster and Suarez, 1999). One framework was established to enlarge the application of the climate sensitivity model (Li et al., 2007). By using this framework we can quantify not only the climate-induced runoff change, but also the human activities-induced runoff change. The framework named “Hydrological Sensitivity Analysis” has been applicable to various climatic conditions (Tan and Gan, 2015; Wang and Hejazi, 2011; Ye et al., 2013).
The Jiulong River watershed is a medium-sized subtropical coastal watershed in Southeast China, which has experienced drastic land-use change in the past 30 years and plays an important role in the region’s economic and ecological health. Our previous studies generally detected the hydrologic response to climate change and human activities (Huang et al., 2013) and also used the ecohydrologic analysis method to distinguish the relative impact of these two factors on streamflow in the Jiulong River Watershed (Zhang et al., 2015). However, more research is needed to learn how the interaction of these two factors may affect the magnitude of runoff changes. In this article, we aim to elucidate the specific impact of human activities on river runoff dynamics over time in the context of climate change by using the framework of hydrological sensitivity analysis. The findings of this study can deepen our understanding of how the complex interactions between climate and non-climatic factors (e.g. catchment size, increasing water withdrawal, river regulation, and land-use changes) may affect the magnitude of runoff change at watershed scale.
Study Area and Methods
Study Area
The Jiulong River Watershed is the second largest watershed in the Fujian Province of Southeast China, residing from 116°46’55” E to 118°02’17” E and 24°23’53” N to 25°53’38” N (Figure 1). The watershed is situated in a subtropical zone with a monsoon climate. Annual average temperature is 19-21oC. Annual precipitation averages 1400-1800 mm, of which 70% occurs between April and September. The watershed covers 14700 km2 and includes two river reaches, namely, the North River and the West River. The river flows into Jiulong River estuary and Xiamen-Kinmen coast of which red tide events commonly occurred (Yan et al., 2012). Figure 1 shows Natural is the dominant land-cover type in the watershed, accounting for over 73% of the total catchment area, while Agriculture and Built-up account for about 18% and 9% of the total catchment area, respectively.
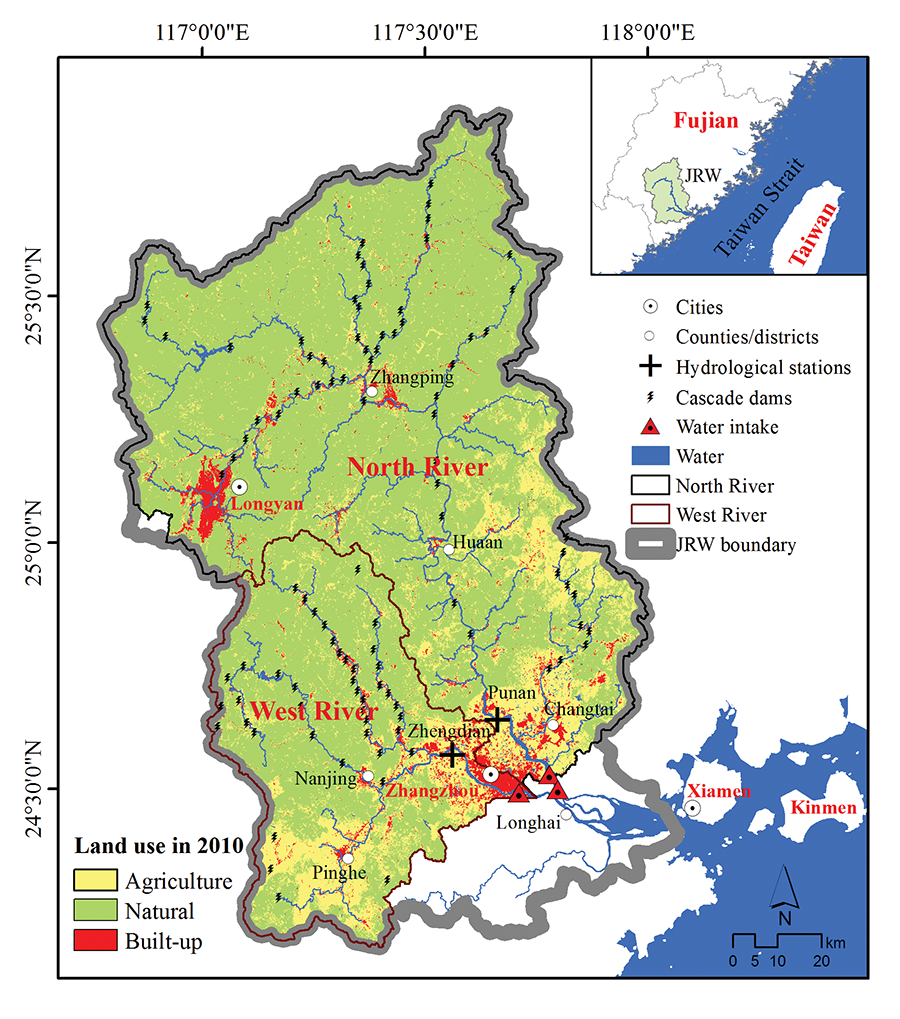
Figure 1. Map of Jiulong River Watershed and location of hydro-meteorological stations.
Generally, the North River has a larger catchment area and steeper slope. The catchment area of the North River is 9560 km2 and that of the West River is 3992 km2. The average elevation of the North River is 613 m and that of the West River is 402 m. Only half as many dams were constructed in the West River compared to the North River. Therefore, water storage capacity in the North River is significantly bigger (about 11.4×10⁸ m3, compared with that in the West River of about 2.8×10⁸ m3 (Zhang et al., 2015)). The upstream region of Jiulong River is mountainous with slope in excess of 18%. In contrast, the downstream end of Jiulong River constitutes of Zhangzhou plain, the largest plain of Fujian province with highly intensive agricultural production.
The study area has undergone intensive land-use changes in the past 30 years, which was associated with the overall economic growth. About 9% of the natural features i.e. forests were converted into agricultural land in 1980s, following national agricultural policy (Huang et al., 2012). Moreover, the urban area has been growing significantly in recent decades, especially in the downstream area of Jiulong River (e.g. Zhangzhou city). The combination of watershed characteristics, land-use, and human activities in the catchments may influence the magnitude of change in runoff in the context of changing climate variability. Therefore, it is essential to quantify the sensitivity of river runoff to climate changes and human activities.
Data Sources
Long-term record of daily river discharge data (m3/s) during 1961 to 2013 were collected from two hydrological stations in the downstream of the North and West Rivers, namely Punan and Zhendian (see Figure 1). Data of daily precipitation (P) and temperature (T) recorded at two meteorological stations, namely Longyan and Zhangzhou, were used to delineate climate variability in the North and West Rivers. These data were obtained from the China Meteorological Administration website (http://www.cma.gov.cn). Potential evapotranspiration (PET) was estimated with Hargreaves’s equation by using daily mean, minimum, and maximum air temperature as input (Hargreaves et al., 2003). Annual river discharge in m3 was divided by watershed area in km2 to be expressed as an annual runoff depth (R) equivalent in mm.
Methods
Climate Variability
We calculated the fractal dimensions to evaluate the variability of four climatic factors (temperature, solar radiation, potential evapotranspiration, and precipitation) in two meteorological stations from 1961-2013. Fractal dimension analysis is a well-established method for studying geophysical time series dynamics, and has been applied to analyze the climate variability (Xu et al. 2017; Bodri, 1994). Fractal dimension D of climate time series can be derived from Hurst index of meteorological parameters. We estimated Hurst index of climate time series from R/S (rescaled range analysis). For particular climate factor’s time series t=1, 2, …, n, x(t) indicates the value of climate factor at time t, and the mean sequence for any integer Ƭ is defined as:
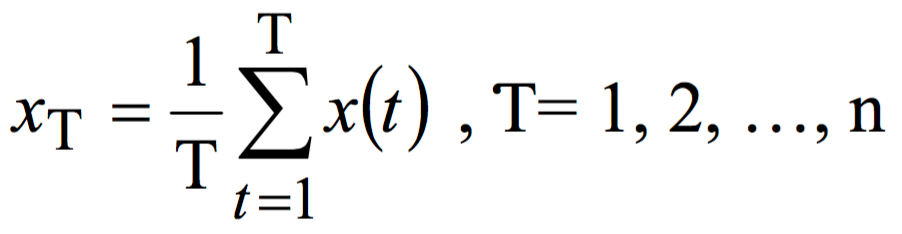
(1)
Cumulative deviation is calculated as: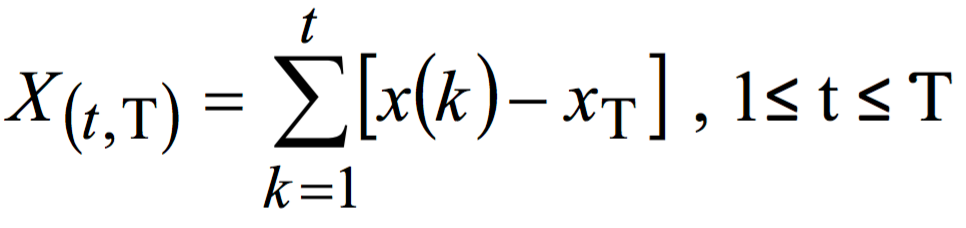
(2)
Range sequence is calculated as: R(T)=max X(t,T)–min X(t,T), t=1,2,…,n
(3)
Standard deviation is computed as: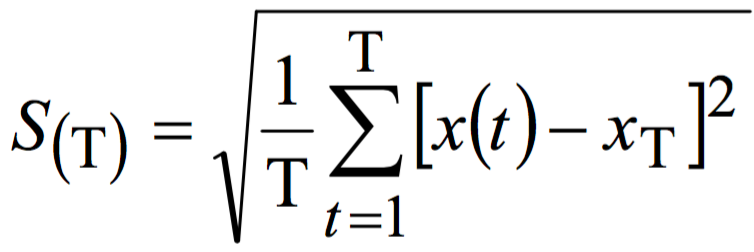
(4)
For the ratio R/S = R(Ƭ)/S(Ƭ), if the following relationship exists: ![]()
(5)
A log transformation is applied to the equation (5), so that log (R/S) has linear relationship with log (T). The slope of this line is the Hurst index, and can be calculated using the least square method. Feder et al. (2013) verified the relationship between fractal dimension D of a time series and its Hurst index H, which is represented as:
D=2–H
(6)
D ranges from 1 to 2. Higher D indicates higher variability of the climate factor dynamic, which indicates the climate factor changes with higher frequency and more uncertainty. Xu et al. (2017) defined the variability of climate system dynamic as the multiplication of fractal dimensions of four climatic factors dynamics:
DClimateSystem = DTemperature *DSolarRadiation *DPET *DPrecipitation
(7)
Trend Analysis
We applied the non-parametric Mann-Kendall test (MK test) to analyze the annual trend of hydro-climatic parameters from 1961 to 2013. This method is widely used to assess change trends in hydrological and meteorological time series worldwide (Moraes et al., 1998; Zhang et al., 2011). MK test assumes that the time series data are independent. The lag-1 serial correlation was therefore examined prior to analysis, and the results (not shown here) revealed that no significant correlation existed in the data, thus all variables can be subjected to the MK test. The theoretical frame of the MK test statistic is:
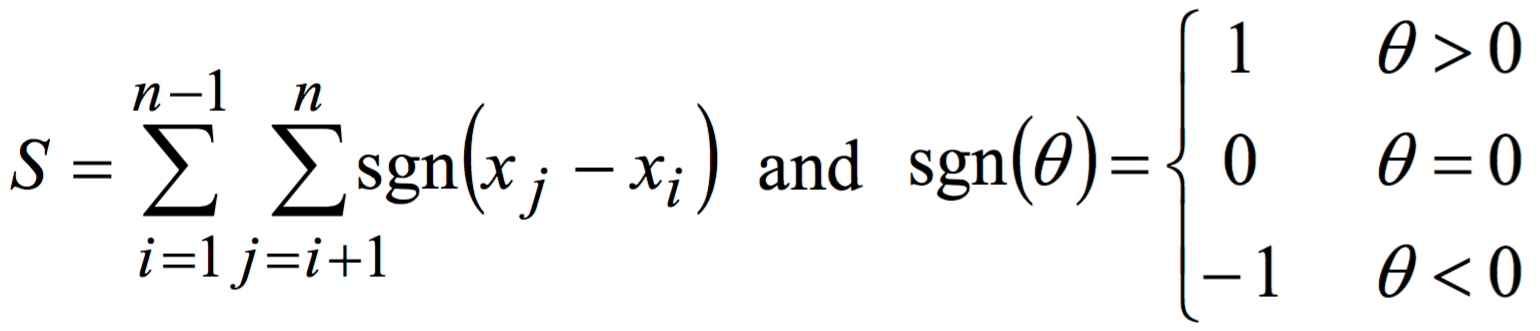
(8)
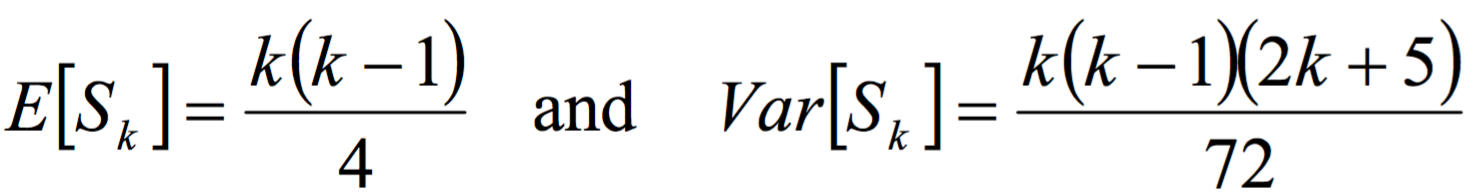
where xi and xj are the sequential data values, and n is the length of the data set. With normal distribution, the mean of S will be zero and variance values are given by:
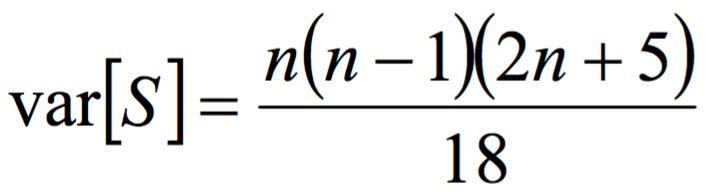
(9)
A normalized test statistic Z is computed as:
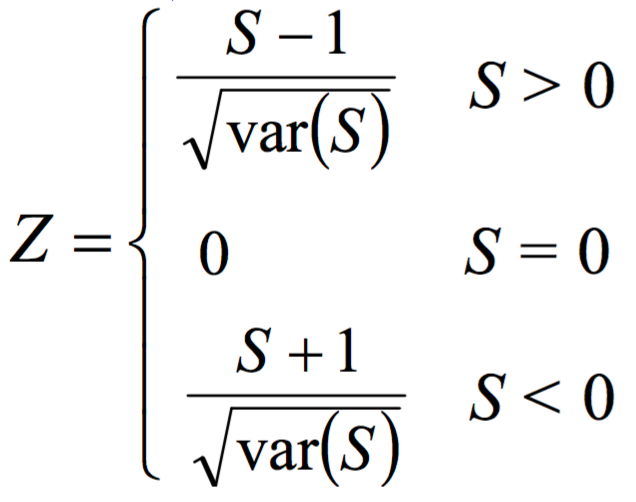
(10)
The null hypothesis Ho states that x1,.., xn are samples of n independent and identically distributed random variables with no temporal change. Positive Z value indicates an increasing trend, while negative Z value indicates a decreasing trend. The significance levels are set at 0.05 with |Za/2| of 1.96. The null hypothesis Ho is rejected when |Z|>1.96.
Change Point Detection
A sequential Mann-Kendall rank statistic was applied to identify the starting point of runoff changes (Ye et al., 2013; Zhang et al., 2011). Letting x1, x2, …, xn be the data values, for each xi, the number ri of xj preceding it (j<i), such that xi>xj were computed. The assumption (null hypothesis) states that the sample under investigation did not have a beginning developing trend. The test statistic was determined using the following formula:
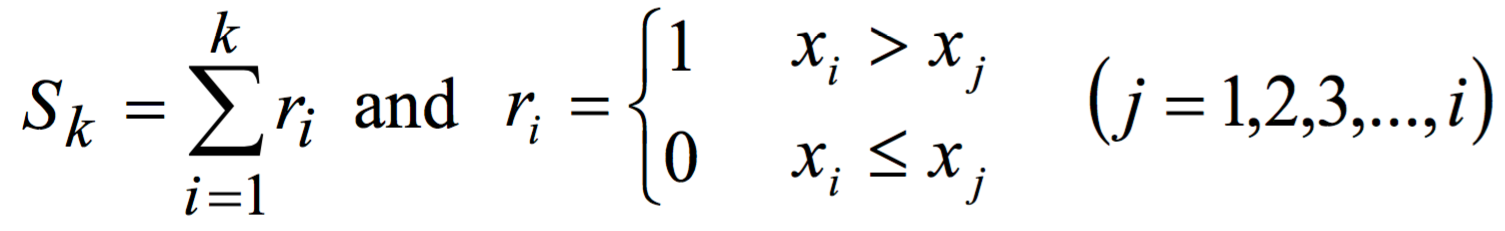
(11)
The test statistic is normally distributed with a mean and variance given by:
(12)
The sequential values of the statistic UFk are calculated as:
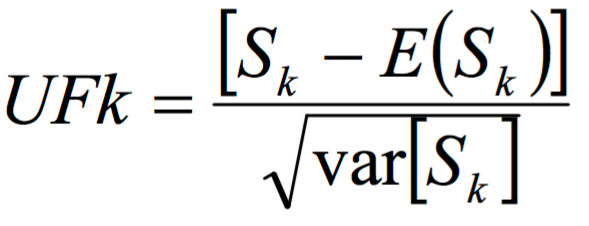
(13)
where UFk is the forward sequence, and the backward sequence UBk is calculated using the same equation but in reverse data series. The null hypothesis (no step change point) is rejected if any of the points in the forward sequence (UFk) are outside the confidence interval. An intersection point of UFk and UBk within the confidence interval indicates a change point. The parts of the curves that exceed the confidence lines represent the time domain of the abrupt change. Through the change-point analysis, the runoff time series were divided into two periods, the baseline period (BP), representing the natural condition of the catchment with limited human activities; and the altered period (AP), when intensive human activities took place.
Hydrological Sensitivity Analysis
The difference between the mean annual runoff during the altered period ![]() and the mean annual runoff during the baseline period
and the mean annual runoff during the baseline period ![]() can represent the total runoff change as combination of climate change and human activity (Li et al., 2007; Wang, 2014):
can represent the total runoff change as combination of climate change and human activity (Li et al., 2007; Wang, 2014):
![]()
(14)
where ∆RC represents the changes of annual runoff induced by climatic change only; ∆RH is the change of annual runoff caused by human activity only. ∆RC indicates the changes observed in the mean annual runoff between altered and baseline period.
According to the climate elasticity model, ∆RC is defined as the change in mean annual runoff in response to the change in mean annual precipitation and potential evapotranspiration (Arora, 2002; Dooge, 1992; Koster and Suarez, 1999):
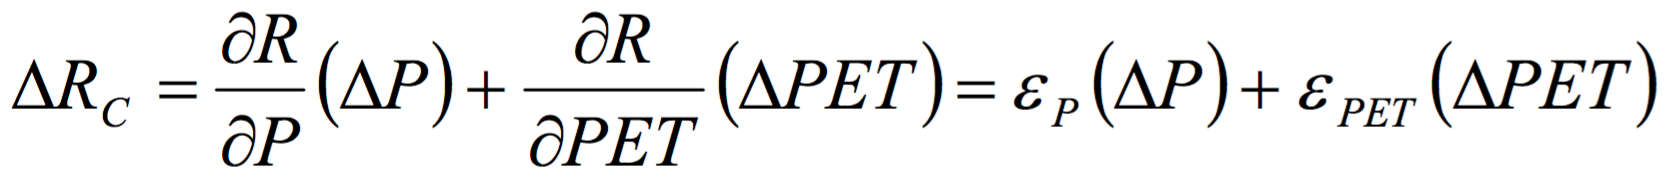
(15)
where P is precipitation; ∆P is the change of precipitation between altered and baseline period; PET is estimated potential evapotranspiration (Hargreaves et al., 2003); ∆PET is the change of PET between altered and baseline period; εp is the sensitivity coefficient of runoff to precipitation; εPET is the sensitivity coefficient of runoff to PET.
The sensitivity coefficient can be computed with Eqs. (16) and (17) under the assumption that storage changes during baseline and altered periods are zero over a long period of time. In fact, we have no data supporting this assumption. There is a lack of information of the groundwater storage change and surface water storage change for the Jiulong River Watershed. However, some other applications of hydrological sensitivity analysis were generally based on the water balance equation. These studies recognized that averaging hydrologic budgets among multiple years would minimize ∆S. Therefore, it is reasonable to assume ∆S is zero over a long period of time (i.e. 10 years) (Li et al. 2007; Zhang et al. 2011; Ye et al. 2013; Li et al. 2014).
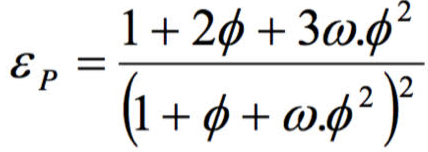
(16)
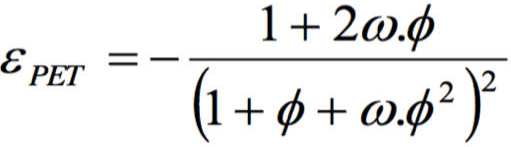
(17)
where 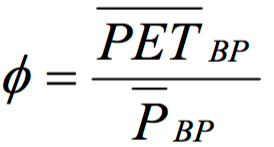 is the aridity index for baseline period; ω is a plant-available water capacity parameter that is related to the vegetation type, soil hydraulic property, and topography (Zhang et al., 2001). ω can be estimated using long-term annual hydro-climatic data using the following equation:
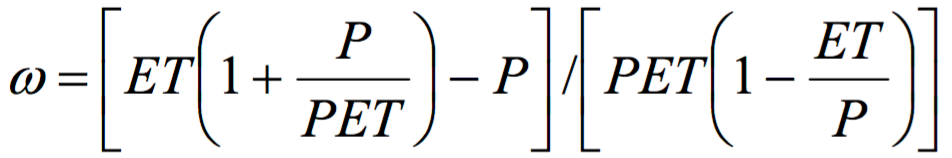
(18)
where ET is the actual evapotranspiration. Averaged over many years, ET is equal to the difference between precipitation and runoff (Milly et al., 2005).
The model parameter ω needs to be calibrated by comparing the observed annual runoff with the predicted annual runoff (RP) during the baseline period:
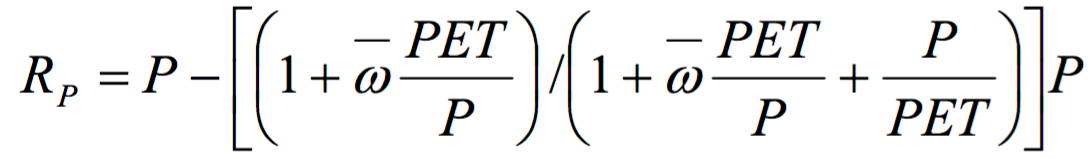
(19)
—
ω is the mean model parameter during the baseline period computed using Equation 18.
The individual contribution of climate variability and human activities on runoff can be expressed as follows
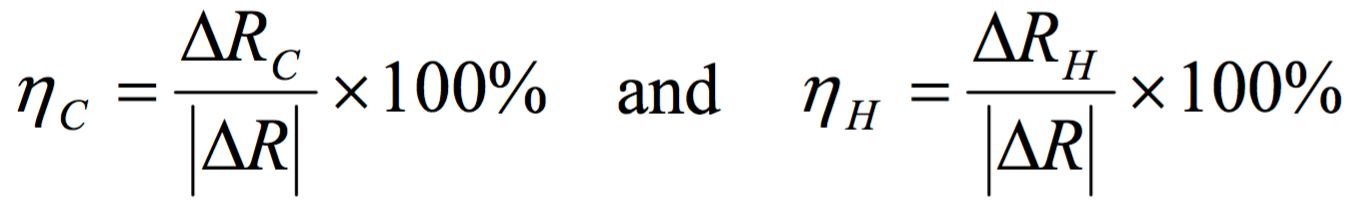
(20)
where ηC is the contribution of climate variability to runoff change; ηΗ is the contribution of human activities to runoff change.
Results
Variability and Trend in Hydro-climatic Variables
The variability of climate system dynamics in the West River is generally larger than in the North River, with fractal dimensions within the interval 3.0-5.5. As for climate factors, potential evapotranspiration had the highest variability, while precipitation had the lowest variability (Table 1). The mean value of the fractal dimension of potential evapotranspiration, solar radiation, temperature, and precipitation in the Jiulong River Watershed are 1.502, 1.484, 1.483, and 1.482, respectively.

Table 1. Variability of climatic system dynamics in the North River and the West River from 1961 to 2013.
*Higher fractal dimension indicates higher variability (D ranges from 1 to 2).
**Variability of climate system dynamics is quantified by multiplying fractal dimensions of four climate factors.
Table 2 shows a long-term trend of hydro-climatic variables for both the North and West Rivers during 1961-2013. The annual runoff showed an increasing trend for both the North and West Rivers with positive Z-value. The positive trends were also observed in climate variables. Among the four climatic factors, temperature presents the most significant increasing trend, while solar radiation decreased significantly. Precipitation and runoff did not show significant trends. However, the synchronized trends among them suggests the increased annual runoff observed in two river reaches of Jiulong River Watershed would be largely related to the increased precipitation and potential evapotranspiration.

Table 2. Results of MK test for annual trend of hydro-climatic variables in the North and West Rivers during 1961-2013.
The positive Z value in the table indicates an upward trend
* significant at p<0.05
Table 2 shows the changes of annual runoff and climatic variables were stronger in the West River. The Z-value for runoff is greater in the West River, compared with those in the North River. The Z-values for climatic variables (i.e. P and PET) are also higher. The Z-value for runoff is relatively higher than those for climates, indicating the catchment of the West River tended to generate more runoff under the increased precipitation. In contrast to the West River, the observed increasing trend of precipitation in the North River is greater than those trends in runoff, likely due to the fact that the larger catchment area of the North River tended to store more surface water for a relatively similar change in precipitation. The different responses to climate change might be affected by watershed morphology, such as catchment size, storage capacity, etc.
Change Point Detection in Annual Runoff
Figure 2 visualizes the period of change in annual runoff using the sequential Mann-Kendall rank statistic. The intersection of UFk and UBk was detected for the year 1974 at 0.05 significant levels for both the North and West Rivers. The annual runoff showed the increasing trends from 1961 to 2001, while the opposite trend was found in the years from 2001 to 2013. An obvious increasing trend was evident in the West River, which is significant during the period 2000-2001 as the values of UFk are above the critical limit. Based on the result of the sequential MK test, the 53-year study period was divided into two periods, the baseline period (1961-1974), representing the natural condition of the catchment with limited human activities; and the altered period (1975-2013) when intensive human activities took place.
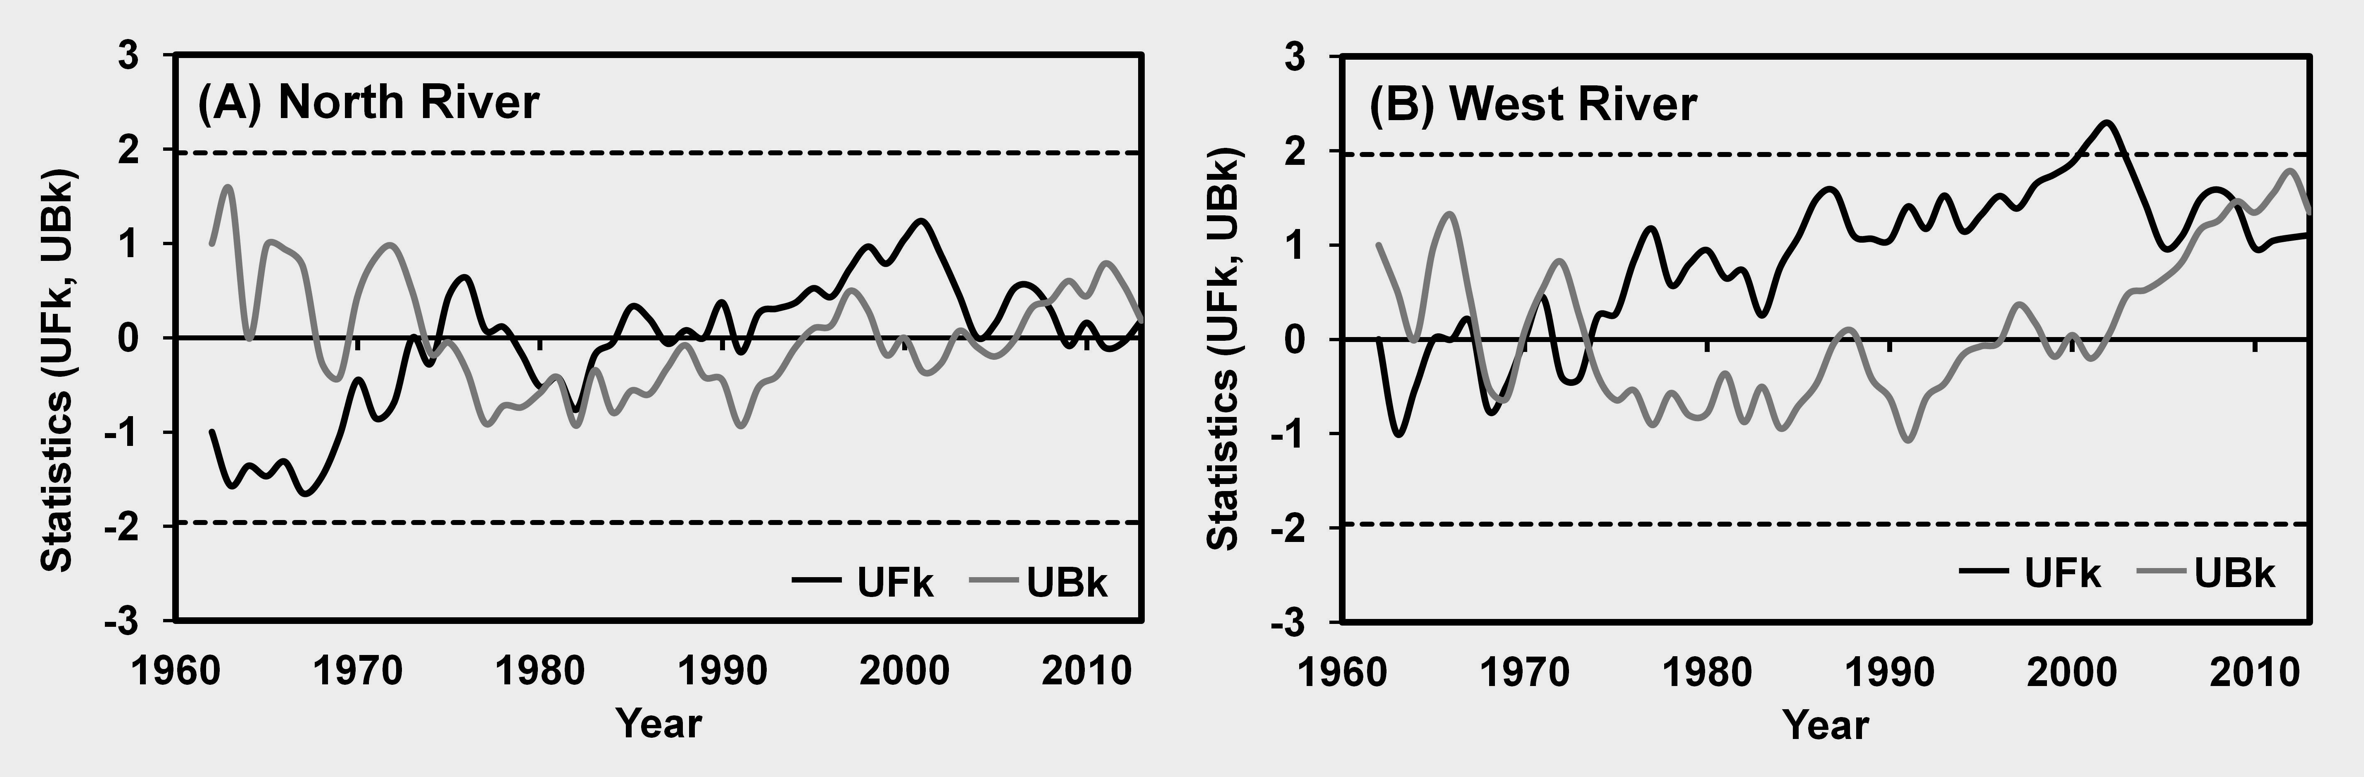
Figure 2. Results of sequential MK test for changes point detection of annual runoff during 1961-2013 in the (a) North River and (b) West River with forward (UFk, black line) and backward (UBk, grey line) sequences. The horizontal dashed lines represent the 0.05 significance level.
Figure 3 shows the changes of annual and seasonal runoff between two periods. The mean annual runoff during the altered period increased by 31 mm (3.5%) and 93 mm (11.6%) for the North and West Rivers, respectively, compared to baseline period. Hydrological regime also increased seasonality. Mean monthly runoff increased in nearly all seasons, especially in spring (February-April) by 34-38%. However, mean monthly runoff of the North River during summer decreased up to 13%.

Figure 3. Changes of annual and seasonal runoff between two periods in the (a) North River and (b) West River. The blue and red boxes represent the mean runoff during the baseline and altered period, respectively.
Figure 4 shows the correlation between annual precipitation and runoff in the North and West Rivers for the two periods. Runoff exhibited a positive linear correlation with precipitation with r-values greater than 0.80. The relationship between precipitation and runoff during the baseline period was relatively stronger than that during the altered period. This suggests that annual runoff dynamic during the altered period was affected not only by climate variability.
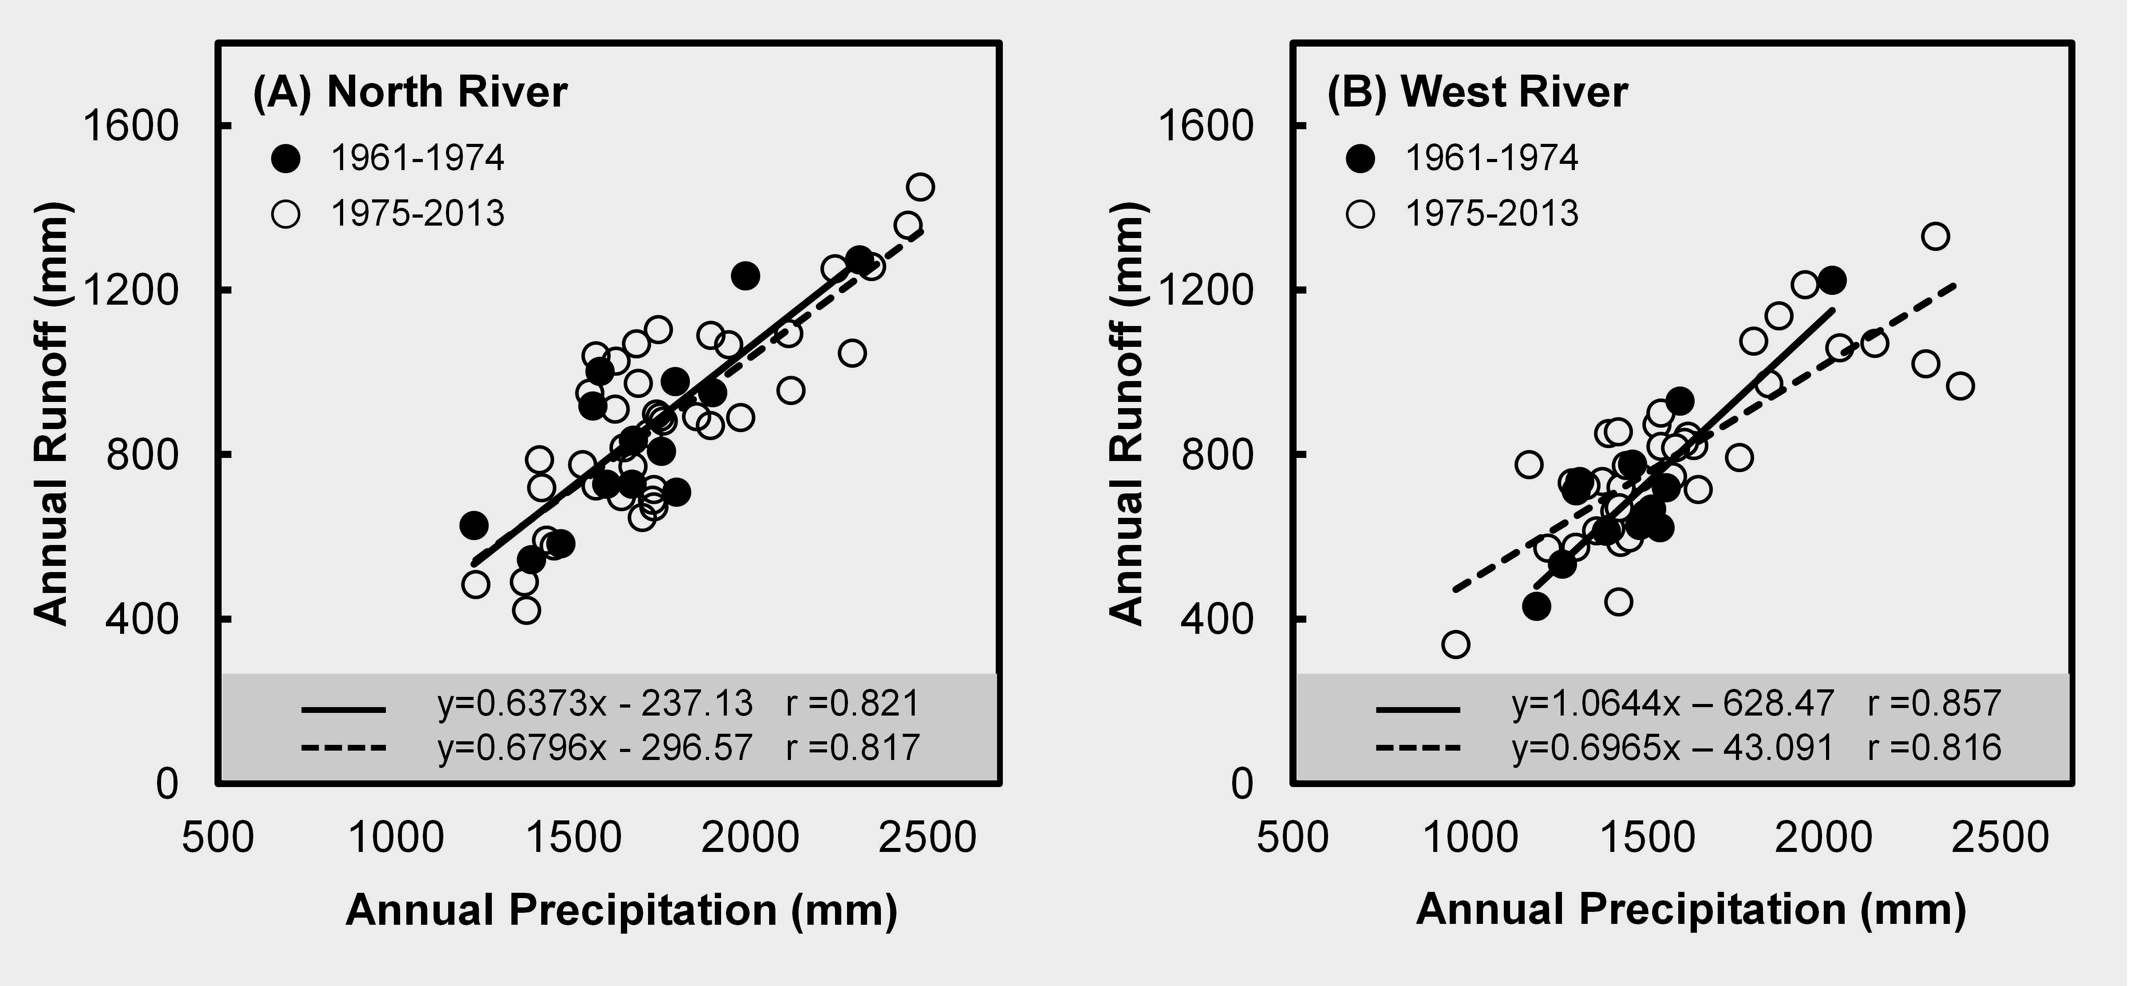
Figure 4. Correlations between annual precipitation and annual runoff during the two periods in the (a) North River and (b) West River.
The Relative Impact of Climate Change and Human Activities on Runoff
Both the climate and human activity played important roles in watershed hydrology, yet the individual impacts of these two factors on runoff changes are difficult to separate. The hydrological sensitivity analyses were carried out to estimate the individual contribution of climate changes on runoff, given the changes in precipitation and potential evapotranspiration using Equations 8-10. The ω as the model parameter represents the plant-available water coefficient and was estimated to be 0.45 and 0.38 for the North and West Rivers, respectively. Figure 5 presents the plots between the observed annual runoff against the predicted annual runoff during the baseline period (1961-1974) with R2 values of 0.703 and 0.757 for the North and West Rivers, respectively. The R2 values are greater than 0.70 indicating that the simulated results are acceptable. According to the estimated ω values, the sensitivity coefficient of runoff to precipitation (εp) was 0.80 and 0.78 for the North and West Rivers, respectively. The sensitivity coefficient of runoff to PET (εPET) was -0.57 and -0.36 for the North and West Rivers, respectively. The greater values of εp revealed that the changes in runoff were more sensitive to precipitation than to potential evapotranspiration.
Table 3 shows the relative impact of climate change and human activities on annual runoff for the North and West Rivers. The specific impact of climate change on runoff was generally positive, i.e. climate change resulted in increased mean annual runoff during the altered period for about 58 mm and 90 mm for the North and West Rivers, respectively. The proportional change in annual runoff due to climate change (ηC) ranges from 97 to 193%. The impact of climate change was greater for the West River, compared with that of the North River.
As shown in Table 3, the impact of human activities on runoff was negative in the North River, accounting for about 27 mm of the decline in runoff during the altered period, whereas the slight increase in mean annual runoff by 3 mm was found in the West River attributed to human activity. The proportional change in annual runoff due to human activities (ηH) ranges from -93 to 3%. Human activity tend to exert more impacts on the North River. Climate changes alone would have increased annual runoff by 58 mm, which was much higher than the observed change in the North River of about 31 mm. In general, the impact of climate change on annual runoff was estimated to be higher than that of human activity.
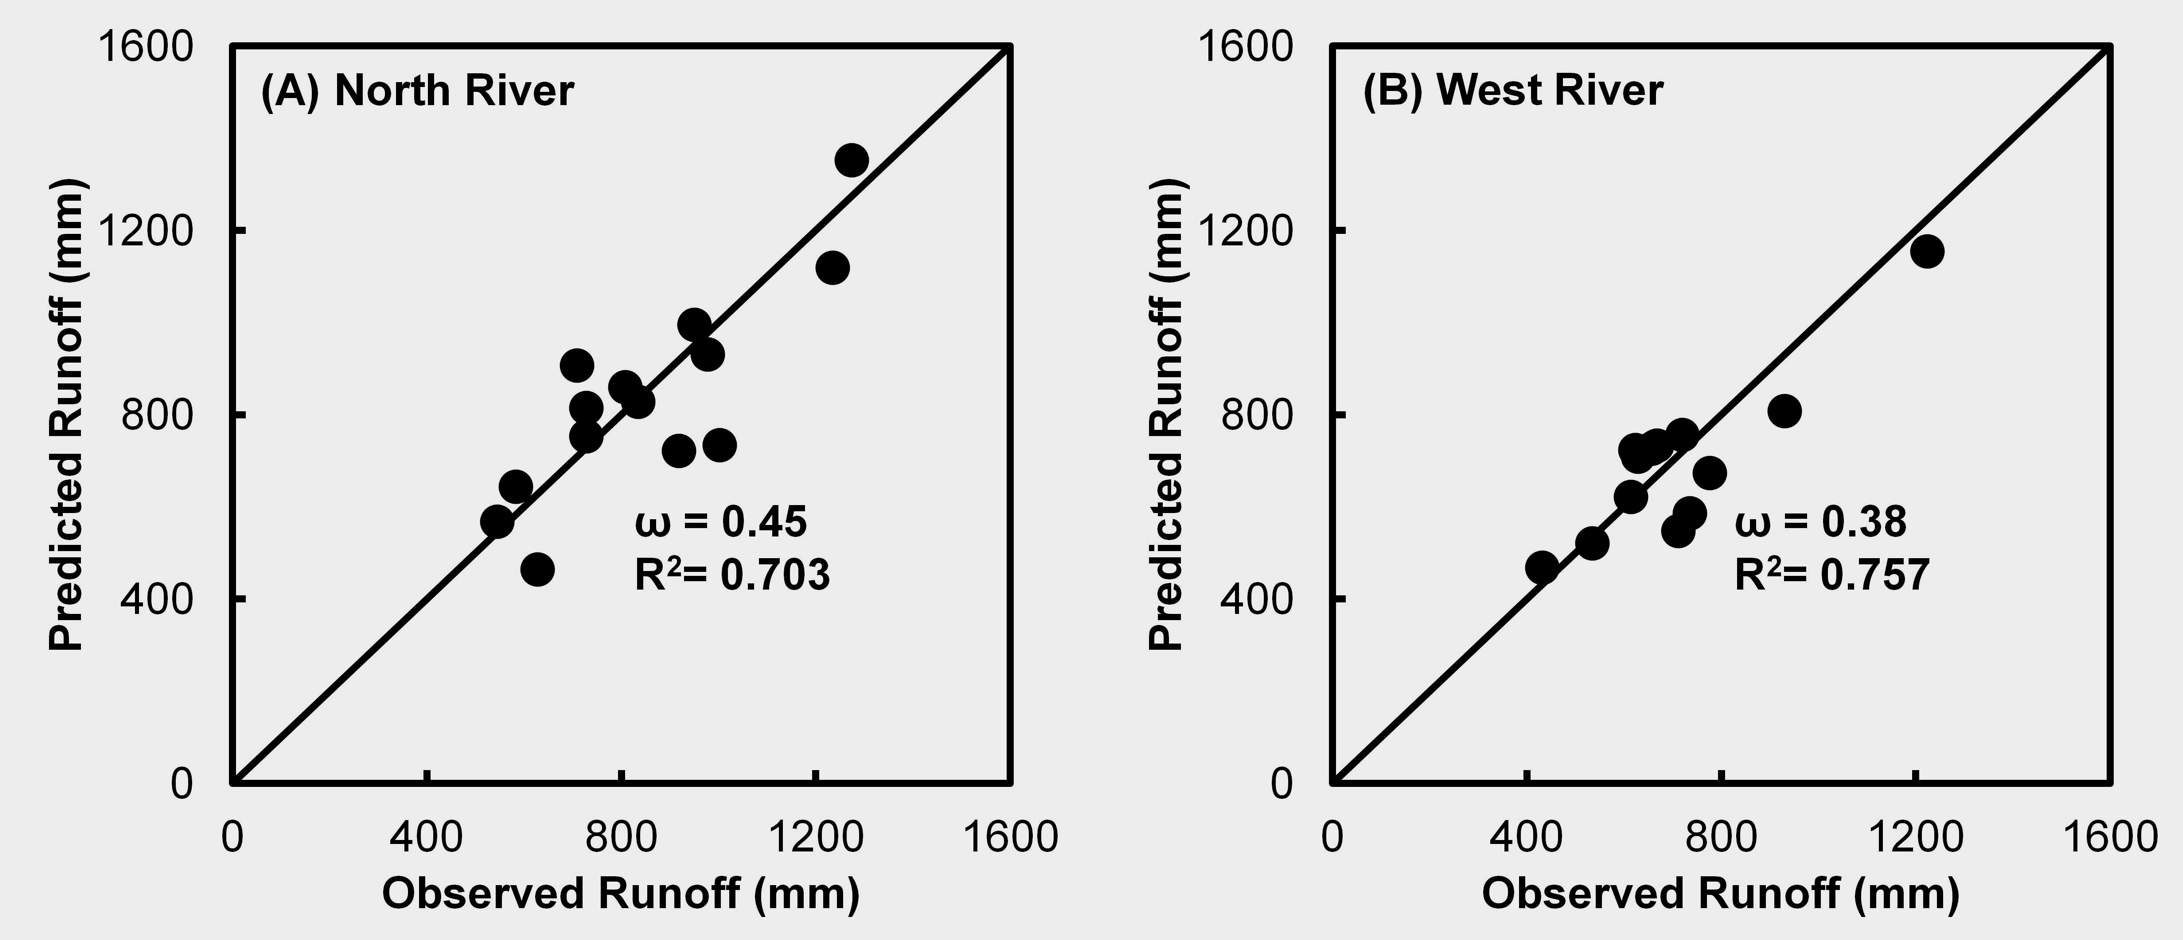
Figure 5. Correlations between observed and predicted annual runoff during the baseline period (1961-1974) in the (a) North River and (b) West River.

Table 3. Contributions of climate variability and human activities on changes in mean annual runoff during the altered period in the North and West Rivers.
Discussion
Contribution of Climate Variability to Annual Runoff Changes
Climate change is one of the most important factors driving the change in the global hydrological cycle through the changes of precipitaton and potential evapotranspiration pattern (Arnell and Gosling, 2013; Milly et al., 2005). This study shows that the variability of climate system dynamics in the West River is generally larger than in the North River. Geographically, the weather station of the West River is located in the higher longitude, relatively closed to the estuary. Huang et al. (2013) noted that an increasing tendency of precipitation is stronger from inland to estuary. Furthermore, Xu et al. (2017) observed the distinct spatial pattern of climate variability between the north and the south of China. Our study found that the Jiulong River Watershed has less complex climate system dynamics, compared with some regions in north China (e.g., Inner Mongolia, northeast Xinjiang, and northwest Heilongjiang) with fractal dimensions within interval 5.50-8.00 (Xu et al., 2017),
Average annual precipitation in the JRW showed an increasing trend over the period 1961-2013, resulting in the increased annual runoff in the North and West Rivers. Both river reaches indicate no significant trends, neither in precipitation nor in runoff. A weak statistical significance, however, does not necessarily indicate that variables are intrinsically unimportant in understanding the climate change impact on hydrological cycle. Several possible statistical factors may explain the occurrence of statistically insignificant coefficients, such as the number of observations and the level of collinear variability in the explanatory factors. Since the runoff generation process can be considered as the conversion of precipitation to runoff (Chen et al. 2007), insignificant trends in precipitation will likely affect the trends in annual runoff. It was not only in the JRW that precipitation did not show significant trends, but also in most regions of China over half a century (Xu et al. 2017). The previous study suggested that the precipitation variability in the JRW may be attributed to global climate change (Huang et al. 2013). Xu et al. (2017) also emphasized that the variability of precipitation in China is potentially influenced by some factors outside of China on a larger scale, such as the East Asian monsoon, El Nino phenomenon, and sunspot activity.
The present study attempted to investigate the impact of climate change on runoff at watershed scale, particularly the human-disturbed watershed of Jiulong River. The observed increased annual runoff in the North and West Rivers were synchronized with those trends in climatic variables. More specifically, runoff change was more sensitive to changes in precipitation than to potential evapotranspiration (εp > εPET). The magnified annual runoff in the present study confirms the finding of other studies in the Southeast China region, such as Poyang Lake Catchment, Dongjiang Basin, and downstream of Yangtze River, where the increased precipitation has been experienced (He et al., 2013; Piao et al., 2010; Ye et al., 2013). Our attempt to separate the individual impact of climate changes on runoff from that of human activities was carried out through hydrological sensitivity analysis. Generally, climate variability was identified as the dominant factor driving the increased annual runoff in the two river reaches of Jiulong River Watershed, while human activities played a secondary role. Climate change induced runoff was estimated to be 58-90 mm. The finding is comparable with other long-term observations in Southern China watershed (i.e. Poyang Lake) of which climate change resulted in an increased annual runoff of 75.3-261.7 mm (Ye et al., 2013). In contrast, the climate change resulted on the reduction of annual runoff in Northeast China (i.e. Hun-Tai River) by 15-34 mm (Zhang et al., 2011).
An increased annual runoff induced by climate change was more pronounced in the West River. For one thing, it was strongly related to the stronger signal of climate changes. Our previous study revealed that the annual frequency of rainstorm events in the West River has increased from 5.1 days to 5.6 days over the past five decades (Huang et al., 2013). Another factor that could trigger the catchment of the West River to be more affected by climate change is the watershed characteristic, given the increasing tendency in annual runoff was relatively higher than that in annual precipitation. The West River has smaller catchment size, smaller storage capacity, and only half as many dams were constructed in the West River compared to the North River. This suggests that smaller catchment would be quicker to reach saturation under more intense precipitation, hence higher runoff.
Human Activities Contribution on Annual Runoff Changes
In addition to climate variability, watershed hydrology is also affected by land-use practices, vegetation cover, soil permeability, river regulation, etc. Changes in these factors are mostly attributed to human activity (Tomer and Schiling, 2009). The present study found that human activity in Jiulong River Watershed played a more important role in the reduction of annual runoff. A similar observation was found in Songhua river basin where human activities were the main cause for the decrease of annual runoff for about 18-88 mm (Li et al., 2014). Another study highlighted that industrial and domestic water use in China has increased dramatically from 7 billion m3 in 1980s to 21 billion m3 in 2005 (Zhang et al., 2011). Increasing water demand often reflects high population density and industrial development. As for the Jiulong River Watershed, statistical data shows the population has increased from 2.5 million in 1981 to 3.5 million in 2014; GDP has increased more significantly from 2.1 billion RMB in 1981 to 253.4 billion RMB in 2014; and the water withdrawal consequently increased from 144 million m3 in 1999 to 388 million m3 in 2015 (Figure 6). Like many regions in China, the increasing water withdrawal from rivers and reservoirs would be the main factor for the decreased annual runoff, especially in the North River.
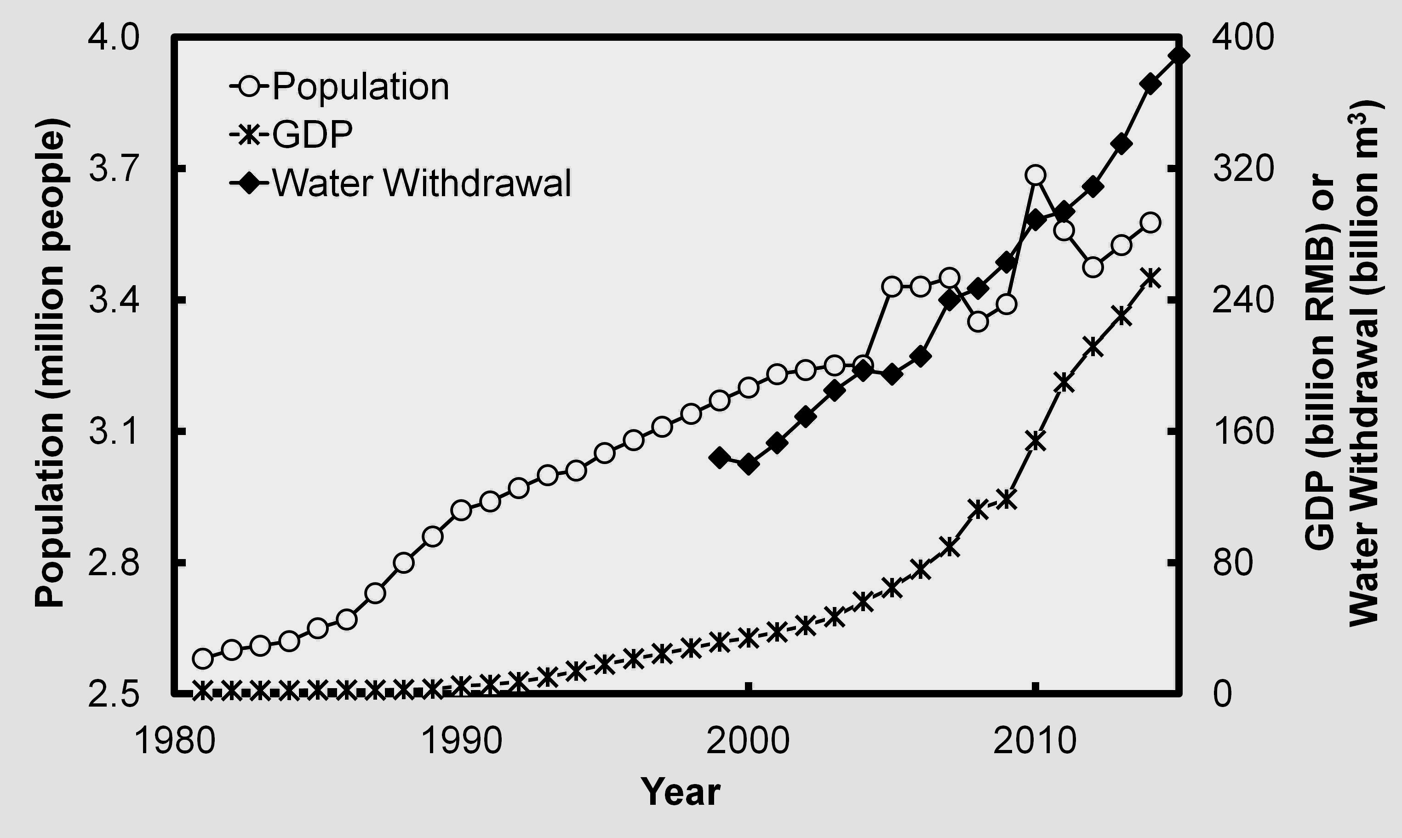
Figure 6. Trends in population, GDP, and water withdrawal in the Jiulong River Watershed over the period of 1981 to 2014.
Another factor with considerable impacts on catchment hydrology is flow regulation, i.e., dam constructions which may influence seasonal runoff and alter the annual runoff dynamic. This study found the mean monthly runoff increased in nearly all seasons, except the decrease of summer high flow of North River up to 13%. Dams have changed streamflow characteristics of Jiulong River through homogenizing high flow events and increasing the monthly low flow (Zhang et al., 2015). This is understandable because dams aimed not only for hydroelectric power but also for flood control, particularly in North River where almost twice as many dams have been constructed compared to the West River. Besides altering the seasonal runoff, dams have decreased the annual discharge of Yellow River by 2.3%, corresponding to the increased evaporation by approximately 68% (He et al., 2013).
Land-use change is another non-neglectable aspect that could affect runoff reduction. Huang et al. (2012) observed the agricultural area in Jiulong River Watershed has been shrinking since 1996, following the gradual increase of natural vegetation. Land conservation practices (i.e. reforestation) will lead to large and spatially extensive decreases of long-term mean annual runoff (Trabucco et al., 2008). For example, in Hun-Tai river basin, increased vegetation and soil conservation contributed largely to the declined annual runoff by 20-44 mm, higher than that of climate change (Zhang et al., 2011). More specifically, increasing evapotranspiration of 5-15% which was related to conversion of cropland into forest resulted in a 10-30% decrease in total runoff of the Great Lake region (Mao and Cherkauer, 2009). Reforestation which can result in increased infiltration and evapotranspiration would have a probability to lower runoff generation.
On the other hand, urbanization might also have affected the watershed hydrology towards the increasing annual runoff. Rapid economic development in coastal regions including the Jiulong River Watershed have caused dramatic changes in land use, especially the built-up areas (Huang et al., 2012; Zhou et al., 2014). A number of studies pointed out that the impacts of urbanization were more likely to affect the streamflow variation by magnifying the peak flow during flood events rather than the annual runoff (Du et al., 2012; Martin et al., 2012; Remondi et al., 2016). However, since the evapotranspiration is significantly controlled by vegetation, the increased impervious cover associated with urbanization would consequently lower the evapotranspiration and hence cause higher annual runoff. This may explain the small increase in annual runoff in the West River attributed to human activities.
Conclusion
This study applied hydrological sensitivity analysis to estimate and distinguish the individual contribution of climate change on annual runoff changes in Jiulong River watershed from that of human activity over the past five decades. Climate change was identified as the main factor controlling the increase in mean annual runoff during the altered period in the North and West Rivers. The impacts of climate change were greater than that of human activity. In addition to climate changes, the watershed characteristics of the West River were partly responsible for the higher magnitude of increased annual runoff. The smaller catchment of the West River would be quicker to reach saturation under more intense precipitation, resulting in higher runoff. Meanwhile, the combined effects of climate and human activity were identified to contribute to annual runoff change in the North River. Human activities (e.g. increasing water withdrawal, constructions of dams, and reforestation) were responsible for annual runoff reduction in the North River. The impacts of human activities on annual runoff were likely to counteract those impacts of climate change, leading to a small increase in observed annual runoff in the North River during altered period. It is evident that human activities may buffer the severity of hydrological changes associated with climate changes, particularly in Southeast China region where more intense and extreme weather events have been experienced. The present study suggests the smaller catchments should receive more attention in terms of mitigation or adaption to hydrological hazards associated with climate changes.
Acknowledgements
This study was supported by the Natural National Science Foundation of China (Grant No. 41471154; 4161101257) and the Fundamental Research Funds for the Xiamen Universities (Grant No. 20720150129). The authors extend their thanks to the Hydrological Bureau of Fujian Province for providing the daily discharge data. We would like to express our gratitude to all the anonymous reviewers that supplied constructive feedback.
References
Ahn KH, Merwade V (2014). Quantifying the relative impact of climate and human activities on streamflow. J Hydrol 515: 257–266.
Arnell NW, Gosling SN (2013). The impacts of climate change on river flow regimes at the global scale. J Hydrol 486: 351–364.
Arora VK (2002). The use of the aridity index to assess climate change effect on annual runoff. J Hydrol 265: 164–177.
Bodri L (1994). Fractal analysis of climate data: Mean annual temperature records in Hungary. Theor. Appl. Climatol. 49, 53-57.
Bronstert A, Niehoff D, Brger G (2002). Effects of climate and land-use change on storm runoff generation: present knowledge and modelling capabilities. Hydrol Proc 16(2): 509–529.
Dooge JCI (1992). Sensitivity of runoff to climate change: A Hortonian approach. B Am Meteorol S 73(12): 2013–2024.
Du J, Qian L, Rui H, Zuo T, Zheng D, Xu Y, Xu CY (2012). Assessing the effects of urbanization on annual runoff and flood events using an integrated hydrological modeling system for Qinhuai River basin, China. J Hydrol 464-465: 127–139.
Feder, J (2013). Fractals. Springer Science & Business Media.
Ficklin DL, Luo Y, Luedeling E, Zhang M (2009). Climate change sensitivity assessment of a highly agricultural watershed using SWAT. J Hydrol 374: 16–29.
Hägg HE, Lyon SW, Wällstedt T, Mörth CM, Claremar B, Humborg (2014). Future nutrient load scenarios for the Baltic Sea due to climate and lifestyle changes. AMBIO 43: 337-351.
Hargreaves GH, ASCE, F, Allen RG (2003). History and evaluation of Hargreaves evapotranspiration equation. J Irrig Drain Eng 129: 53–63.
He B, Miao C, Shi W (2013). Trend, abrupt change, and periodicity of streamflow in the mainstream of Yellow River. Environ Monit Assess 185: 6187–6199.
He Y, Lin K, Chen X (2013). Effect of land use and climate change on runoff in the Dongjiang Basin of South China. Math Probl Eng. 2013;2013: 1–14.
Hopkins KG, Morse NB, Bain DJ, Bettez ND, Grimm NB, Morse JL, Palta MM, Shuster WD, Bratt AR, Suchy AK (2015). Assessment of regional variation in streamflow response to urbanization and the persistence of physiography. Environ Sci Technol. 49: 2724–2732.
Huang J, Pontius JRG, Li Q, Zhang Y (2012). Use of intensity analysis to link patterns with processes of land change from 1986 to 2007 in a coastal watershed of southeast China. Appl Geogr 34: 371–384.
Huang J, Zhang Z, Feng Y, Hong H (2013). Hydrologic response to climate change and human activities in a subtropical coastal watershed of southeast China. Reg Environ Change 13: 1195–1210.
Huang JC, Lee TY, Lee JY (2014). Observed magnified runoff response to rainfall intensification under global warming. Environ Res Lett 9: 1–7.
Koster RD, Suarez MJ (1999). A simple framework for examining the interannual variability of land surface moisture fluxes. J Climate 12: 1911–1917.
Lee TY, Huang JC, Lee JY, Jien SH, Zehetner F, Kao SJ (2015). Magnified sediment export of small mountainous rivers in Taiwan: chain reactions from increased rainfall intensity under global warming. PLOS ONE 10(9): 1–14.
Legesse D, Vallet-Coulomb C, Gasse F (2003). Hydrological response of a catchment to climate and land use changes in Tropical Africa: case study south central Ethiopia. J Hydrol 275(1–2): 67–85.
Li F, Zhan G, Xu YJ (2014). Separating the impacts of climate variation and human activities on runoff in the Songhua River Basin, Northeast China. Water 6: 3320–3337.
Li LJ, Zhang L, Wang H, Wang J, Yang JW, Jiang J, Li JY, Qin DY (2007). Assessing the impact of climate variability and human activities on streamflow from the Wuding River basin in China. Hydrol Process 21: 3485–3491.
Mao D, Cherkauer KA (2009). Impacts of land-use change on hydrologic responses in the Great Lakes region. J Hydrol 374(1–2): 71–82.
Martin EH, Kelleher C, Wagener T (2012). Has urbanization changed ecological streamflow characteristics in Maine (USA)? Hydrolog Sci J 57(7): 1337–1354.
Milly PCD, Dunne KA, Vecchia AV (2005). Global pattern of trends in streamflow and water availability in a changing climate. Nature 438: 347–350.
Moraes JM, Pellegrino GQ, Ballester MV, Martinelli, LA, Victoria, RL, Krusche AV (1998). Trends in hydrological parameters of a Southern Brazilian Watershed and its relation to human induced changes. Water Resour Manag 12: 295–311.
National Oceanic and Atmospheric Administration (2013). NOAA, U.S. Census report finds increases in coastal population growth by 2020 likely, putting more people at risk of extreme weather. (http://www.noaanews.noaa.gov/stories2013/20130325_coastalpopulation.html)
Piao S, Ciais P, Huang Y, Shen Z, Peng S, Li J, Zhou L, Liu H, Ma Y, Ding Y, Friedlingstein P, Liu C, Tan K, Yu Y, Zhang T, Fang J (2010). The impacts of climate change on water resources and agriculture in China. Nature 467: 43–51.
Remondi F, Burlando P, Vollmer D (2016). Exploring the hydrological impact of increasing urbanisation on a tropical river catchment of the metropolitan Jakarta, Indonesia. Sustainable Cities and Society 20: 210–221.
Rice JS, Emanuel RE, Vose JM (2016). The influence of watershed characteristics on spatial patterns of trends in annual scale streamflow variability in the continental U.S. J Hydrol 540: 850–860.
Tan X, Gan TY (2015). Contribution of human and climate change impacts to changes in streamflow of Canada. Sci Rep 5(17767): 1–10.
Tomer MD, Schiling KE (2009). A simple approach to distinguish land-use and climate-change effects on watershed hydrology. J Hydrol 376: 24–33.
Trabucco A, Zomer RJ, Bossio DA, van Straaten O, Verchot LV (2008). Climate change mitigation through afforestation/reforestation: a global ana-lysis of hydrologic impacts with four case studies. Agr Ecosyst Environ 126(1-2): 81–97.
Wang D, Hejazi M (2011). Quantifying the relative contribution of the climate and direct human impacts on mean annual streamflow in the contigous United States. Water Resour Res 47: 1–16.
Wang X (2014) Advances in separating effects of climate variability and human activity on stream discharge: An overview. Adv Water Resour 71: 209–218.
Xu Z, Yang Y, Connor T, Li D, Li Y, Liu J (2017). Climate variability and trends at a national scale. Scientific reports, 7: 3258, 1-10.
Yan XL, Zhai WD, Hong HS, Li Y, Guo WD, Huang X (2012). Distribution, fluxes and decadal changes of nutrients in the Jiulong River Estuary, Southwest Taiwan Strait. Chinese Sci Bull 57(18): 2307–2318.
Yang Y, Tian F (2009). Abrupt change of runoff and its major driving factors in Haihe River Catchment, China. J Hydrol 374: 373–383.
Ye Z, Zhang Q, Liu J, Li X, Xu CY (2013). Distinguishing the relative impacts of climate change and human activities on variation of streamflow in the Poyang Lake catchment, China. J Hydrol 494: 83–95.
Zhang L, Dawes WR, Walker GR (2001). Response of mean annual evapotranspiration to vegetation changes at catchment scale. Water Resour Res 37(3):701–708.
Zhang Y, Guan D, Jin C, Wang A, Wu J, Yuan F (2011). Analysis of impacts of climate variability and human activity on streamflow for a river basin in northeast China. J Hydrol 410: 239–247.
Zhang YK, Schilling KE (2006). Increasing streamflow and baseflow in Mississippi River since the 1940s: Effect of land use change. J Hydrol 324: 412–422.
Zhang Z, Chen X, Xu CY, Yuan L, Yong B, Yan S (2011). Evaluating the non-stationary relationship between precipitation and streamflow in nine major basins of China during the past 50 years. J Hydrol 409: 81–93.
Zhang Z, Huang J, Huang Y, Hong H (2015). Streamflow variability response to climate change and cascade dams development in a coastal China watershed. Estuar Coast Shelf S 166: 209–217.
Zhao G, Tian P, Mu X, Jiao J, Wang F, Gao P (2014). Quantifying the impact of climate variability and human activities on streamflow in the middle reaches of the Yellow River basin, China. J Hydrol 519: 387–398.
Zhou P, Huang J, Pontius JRG, Hong H (2014). Land Classification and Change Intensity Analysis in a Coastal Watershed of Southeast China. Sensors 14: 11640–11658.
Zimmermann B, Elsenbeer H, De Moraes JM (2006). The influence of land-use changes on soil hydraulic properties: implications for runoff generation. For Ecol Manage 222(1–3): 29–38.
Discussion
Reviewer A: The model parameter ω was calibrated by comparing the observed annual runoff with the predicted annual runoff during the baseline period, and then the calibrated ω value was used to represent the plan-available water capacity parameter related to the vegetation type, soil hydraulic property and topography for the entire study area over both the baseline and altered periods. But the author also mentioned that the watershed has experienced dramatic land-use change in the past 30 years. So since land use and vegetation have undergone significant change, whether the assumption that parameter ω is a constant value is suitable for this study?
Response: Firstly, the model parameter ω was calibrated during the baseline period in order to calculate the sensitivity coefficients of runoff to precipitation and potential evapotranspiration. By using the constant value for ω, we could estimate the runoff change in the altered period results from climate changes only. Human activities induced runoff changes were estimated using Equation 14. It is true that the watershed has experienced dramatic land-changes, particularly from agriculture to built-up. However, natural forest area remained the dominant land-cover type in the watershed, accounting for 80% of the total watershed area. Comparatively, the urbanization was more likely to affect the seasonal flow rather than the annual runoff. For this reason, using a constant value for parameter ω is suitable for this study.
Reviewer A: What does a greater Z-value mean? It seems that the authors assume that a greater Z-value represents a stronger increasing trend?
Response: The test statistic Z is used a measure of significance of trend. The greater Z-value means a greater Mann Kendall S statistic where a positive value of S indicates an upward trend.
Reviewer A: In Figure 2, it seems that only the increasing trend in West River during the period 2000-2001 is statistically significant. If this is the case, I wonder whether the relative conclusion stated in the nearby paragraph is valid?
Response: We understand the reviewer’s comment. Firstly, the sequential MK test was applied to detect the change point of annual runoff over the past 53 years. An intersection point within the confidence interval indicates a change point (Morases et al. 1998). The change point was detected in the year of 1974 for both North and West Rivers. For this reason, we divided a 53-year study period into two periods, namely, the baseline and altered periods.
Reviewer B: I suspect that the effect of the actual climate variability is hard to be captured in the mean annual runoff. The signatures of the effects of variability of precipitation and temperature may be significantly weakened at the annual scale.
Response: We agree with the reviewer’s comments that climate variability is lower at the annual scale. However, the main objective of this study was to distinguish the relative impact of climate change and human activities on runoff using widely adopted framework named Hydrological Sensitivity Analysis. The framework is based on annual water balance for a catchment, considering the functional relationships exist between annual precipitation, PET, actual ET, and runoff, thus perturbations in both precipitation and potential evapotranspiration can lead to change in water balance. Nevertheless, we found that runoff in Jiulong River Watershed exhibit an increasing trend not only in annual scale but in nearly all seasons, especially in spring (Figure 3). The result indicated that the seasonal changes in runoff have incorporated into the annual runoff changes. Besides, analysis the long-term record of annual hydro-climatic condition will give us a general understanding how the state of current conditions fit into the bigger picture, compared with the baseline condition.
Reviewer B: Why did you choose 1961-1974 as the baseline years? It is 13 years. Do you have any reason for choosing the 13 years, not 10, 15 or 20 years?
Response: We applied the sequential MK test to identify the change point of annual runoff using. An intersection point within the confidence interval indicates a change point. The change point was detected in the year of 1974 for both North and West Rivers. For this reason, we divided a 53-year study period into two periods namely the baseline (1961-1974) and altered periods (1975-2013).
Reviewer B: It is interesting to see that the ET is not a function of PET, even when PET is available. How big is the difference between the ET estimated by precipitation and runoff and the ET estimated by PET?
Response: We appreciate the reviewer’s question. The quantitative assessment of climate change impact on runoff using hydrologic sensitivity analysis is mainly based on water balance equation where the actual ET is equal to the difference between precipitation and runoff, assuming the ∆S is zero over a long period of time (i.e. 10 years). We could not estimate ET by PET because the model parameter ω was unavailable. However, some other applications of hydrological sensitivity analysis did also use the same approach on estimating the actual ET (Ye et al., 2013; Li et al., 2007; Zhang et al., 2011; Tan and Gan, 2015).